In software development and operations, ensuring the stability, performance, and reliability of applications is paramount. Two fundamental practices that form the cornerstone of this endeavor are logging and monitoring. These interconnected processes provide invaluable insights into an application's behavior, enabling developers and operations teams to identify and address issues proactively. The subsequent paragraphs will elaborate on the individual roles and collective importance of logging and monitoring in achieving robust and efficient software systems.
Logging
Logging is the process of capturing system events, errors, performance metrics, and informational messages during the execution of an application. In NodeJS, logs help developers debug issues, trace errors, analyze performance bottlenecks, and understand user behavior. DevOps engineers help in scalable solutions to have proper management and reduces chances of errors in application in use, which makes devOps for streamlining development pipeline.
Common uses of logging:
- Error reporting and debugging
- API call tracing
- Tracking user actions
- Performance profiling
Monitoring
Monitoring refers to observing the system's health and behavior in real-time or near real-time. It includes watching over metrics like CPU usage, memory leaks, response time, network latency, uptime, and user activity. Better software development approach always have the latest web standards in place and always involves logging best practices.
Common uses of monitoring:
- Uptime tracking
- System performance
- Alerting on failures or anomalies
- Preventive maintenance
Together, logging and monitoring form the backbone of observability in NodeJS applications, ensuring the system remains reliable, scalable, and efficient.
Top 10 Logging & Monitoring Tools for NodeJS
1. Winston
Winston is a powerful, extensible, and easy-to-use logging library. It supports multiple transports (console, file, HTTP, MongoDB, etc.) and allows you to define log levels and custom formats. Winston is ideal for applications where structured logs and customizable pipelines are required. Experienced PHP developers can integrate structured logging into legacy systems for better debugging.
- View: Most popular and flexible logging tool for NodeJS applications.
- Best For: Production-grade logging, microservices, and modular applications.
2. Pino
Pino is known for its extremely fast logging performance. It outputs logs in JSON format and is designed for speed, making it an excellent choice for applications where performance matters. It integrates well with logging backends and includes a pretty-print CLI tool for development. NodeJS developers empowers backend systems with best practises required in nowadays modern applications for robustness and reliability.
- View: Fastest and most lightweight NodeJS logger with low overhead.
- Best For: High-performance APIs and serverless applications.
3. Log4js
Log4js is a mature and feature-rich logging library for NodeJS. It provides appenders like console, file, SMTP, and more, allowing flexible log routing. Its design is modular and suitable for applications that require log categorization and rotation. Building with WordPress and implementing error tracking is very necessary for preventing any issues but can be easily done by experienced php developers.
- View: Inspired by Log4j, offering reliable logging with custom appenders.
- Best For: Applications needing log filters, rotation, and categorized logs.
4. Bunyan
Bunyan is another JSON-focused logging library that’s perfect for integrations with log management platforms like ELK or Fluentd. It also includes a CLI tool for viewing logs in a more readable format. With support for serializers and child loggers, Bunyan promotes log clarity and structure.
- View: Structured JSON logging for powerful log parsing and querying.
- Best For: Scalable apps using log aggregation services.
5. PM2 + PM2 Logs
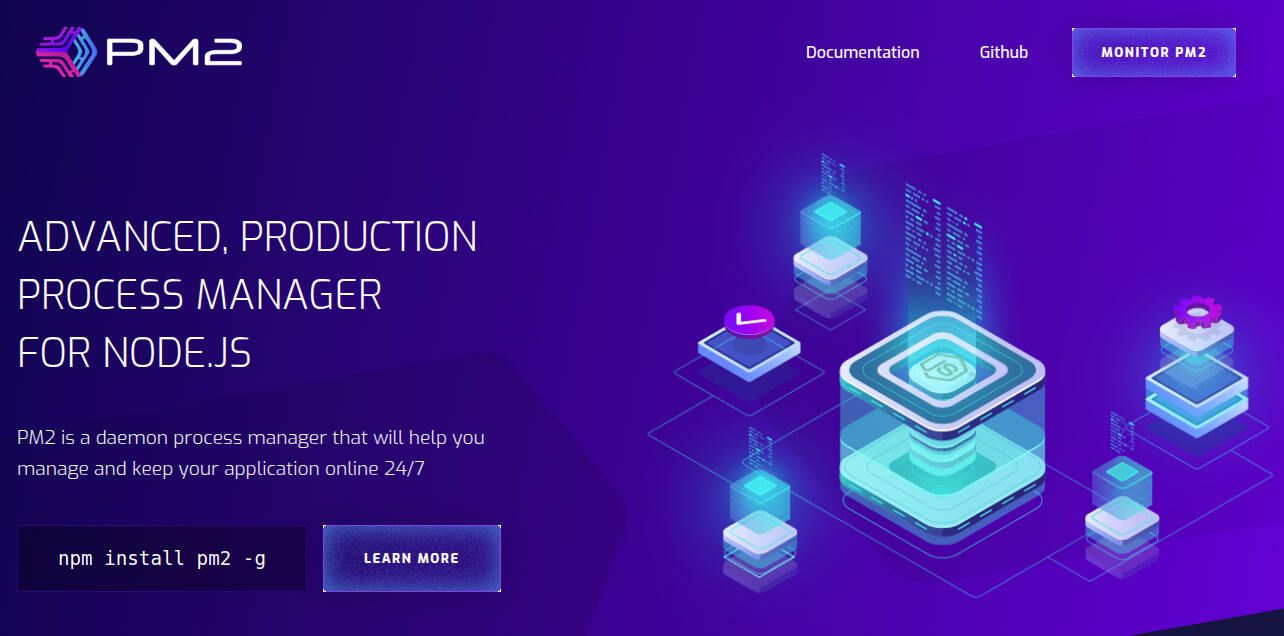
PM2 is much more than a process manager. It also includes logging, monitoring, load balancing, and remote management. Developers can monitor memory, CPU, and logs in real time. PM2 Plus adds even more observability features with a web dashboard.
- View: Process manager with built-in logging and real-time monitoring.
- Best For: NodeJS process management and live server monitoring.
6. Elastic Stack (ELK Stack: Elasticsearch, Logstash, Kibana)
ELK Stack is a collection of tools that help ingest, store, and visualize logs. NodeJS applications can send logs via Logstash or directly to Elasticsearch. Kibana provides interactive dashboards for log analytics, making it easy to investigate errors and track performance metrics.
- View: Enterprise-grade logging and search capabilities for large-scale systems.
- Best For: Centralized log management and complex debugging scenarios.
7. Datadog
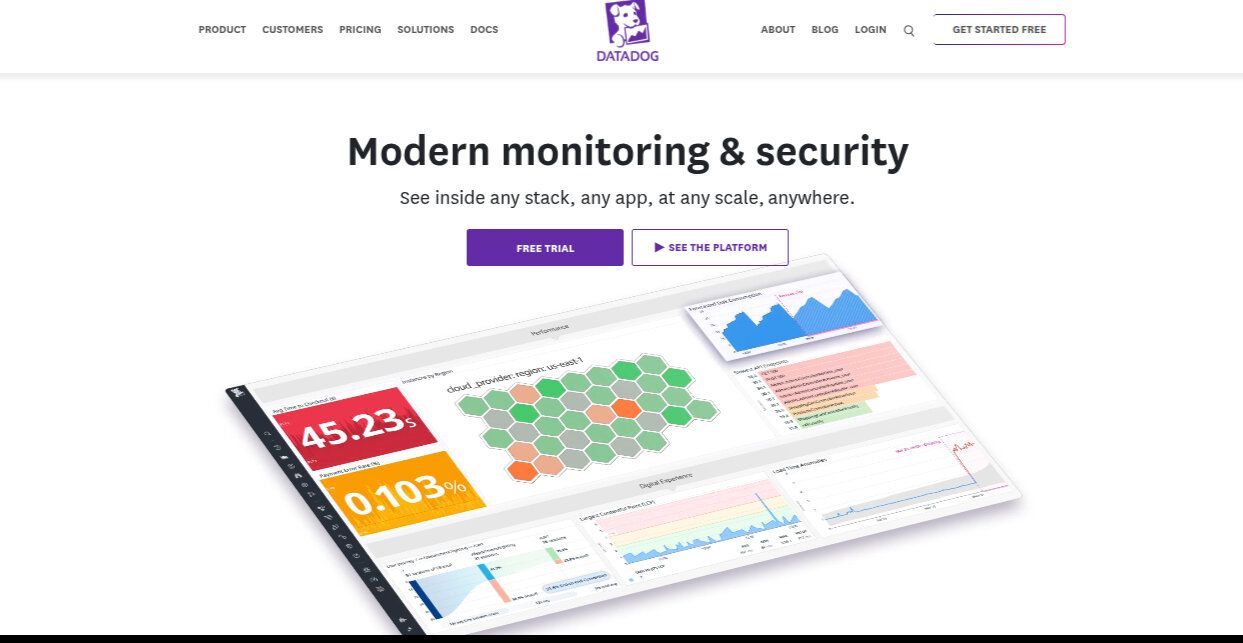
Datadog is a cloud-native monitoring and analytics platform offering real-time insights into application performance. It supports NodeJS with its dedicated libraries, and provides powerful dashboards, alerting, and tracing tools. Logs, metrics, and traces can all be correlated in a single view.
- View: Full observability platform with logging, metrics, and APM in one.
- Best For: Enterprise-grade monitoring, tracing, and log correlation.
8. New Relic
New Relic gives deep visibility into the NodeJS runtime, capturing performance bottlenecks, memory leaks, and transaction traces. It supports distributed tracing, real-user monitoring, and synthetic testing, making it a comprehensive APM solution.
- View: Real-time performance monitoring and error tracking for modern apps.
- Best For: Developers who need deep application insights and performance tracking.
9. Sentry
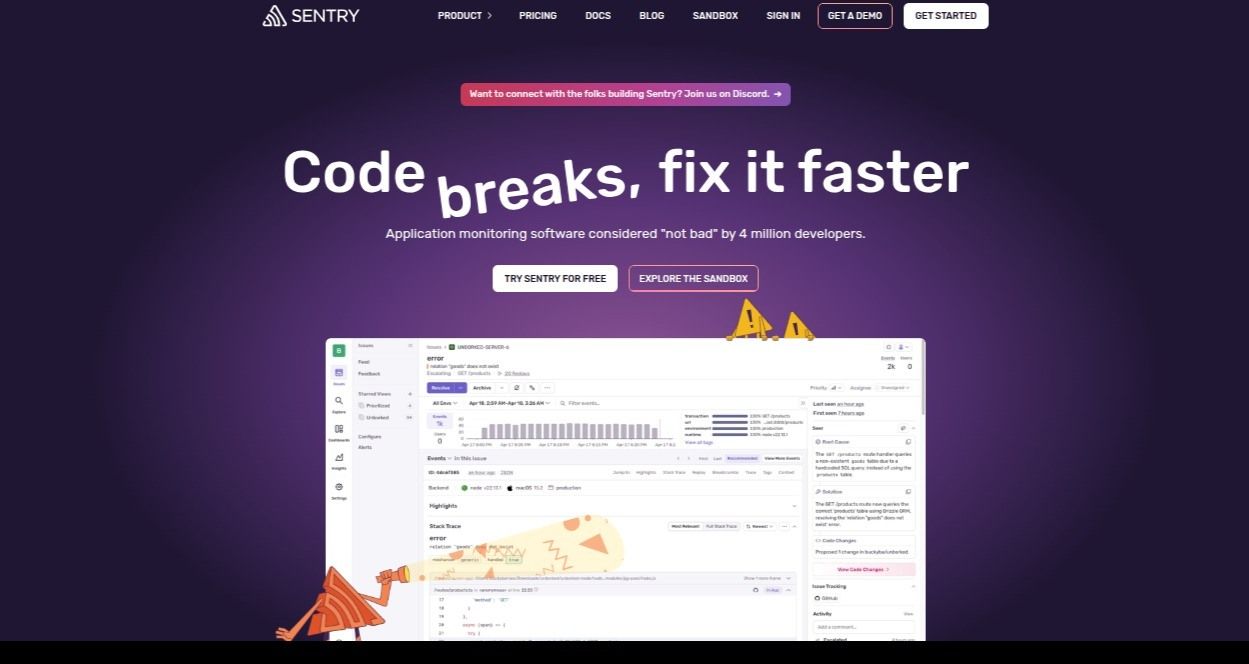
Sentry is widely loved for its simplicity and effectiveness in tracking unhandled exceptions, stack traces, and API errors. With real-time alerts, performance metrics, and release tracking, Sentry integrates seamlessly into any NodeJS stack to enhance error visibility.
- View: Powerful error tracking and performance monitoring tailored for developers.
- Best For: Real-time error debugging and monitoring user-impact issues.
10. Grafana + Prometheus
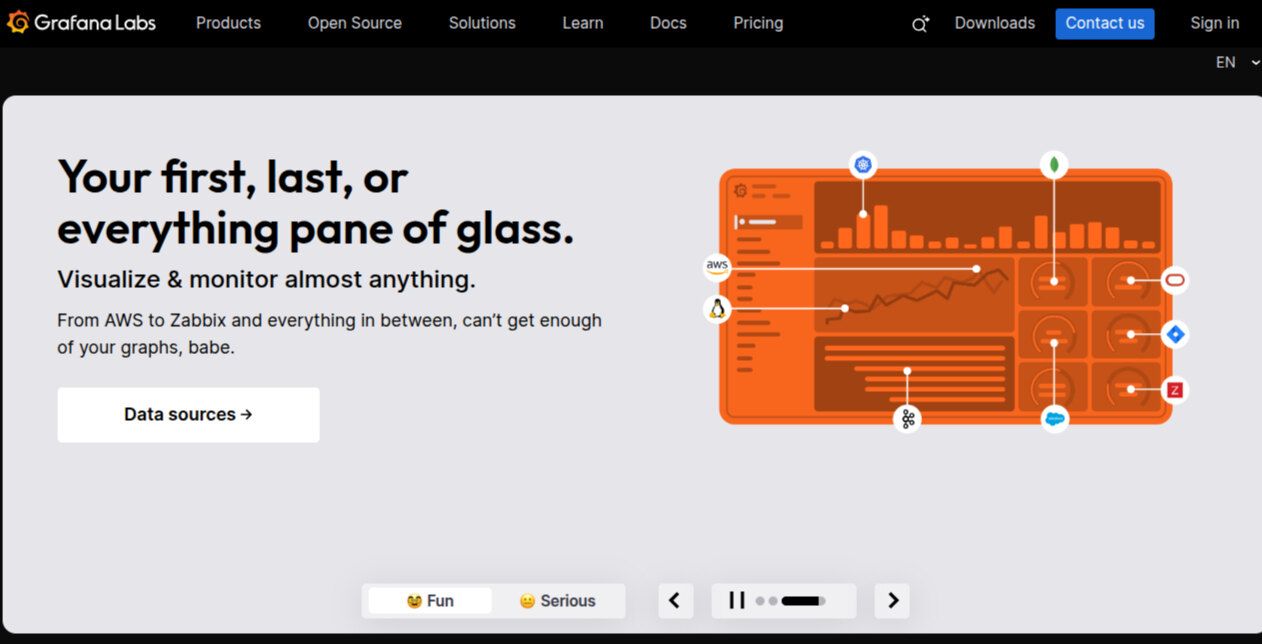
Prometheus collects time-series metrics from your NodeJS application using clients like prom-client. Grafana, in turn, creates dashboards that visualize CPU usage, memory load, request latency, and more. It supports alerting rules and external data sources for a complete monitoring setup.
- View: Custom monitoring stack for real-time metric visualization.
- Best For: Custom metric monitoring with powerful visual dashboards.
The Critical Role of Logging and Monitoring in NodeJS
In the ever-evolving ecosystem of backend development, especially with JavaScript’s dominant runtime—NodeJS—logging and monitoring aren’t optional anymore. They are essential pillars for creating resilient, secure, and high-performing applications. Whether you’re deploying a monolithic NodeJS app or a suite of microservices, observability determines how well you can react to outages, improve user experience, and scale effectively.
Why Logging Matters
At its core, logging answers one critical question: “What went wrong and when?”
Logs are like a flight recorder (black box) of your app. Without them, diagnosing issues is guesswork. Effective logging can:
- Uncover hidden bugs
- Help in tracking request flows
- Offer insights into usage patterns
- Speed up mean time to recovery (MTTR)
For example, in a NodeJS Express app, you might log:
- Incoming HTTP requests with headers
- Outgoing responses with status codes
- Errors with full stack traces
- Authentication attempts
- 3rd-party API interactions
However, not all logs are equal. Without structure, they become noise. JSON-structured logs (offered by Bunyan, Pino) are easier to parse, search, and visualize.
Why Monitoring Is Even More Crucial
If logging is retrospective, monitoring is real-time awareness. You don’t want to know that your server was down after 10,000 users tried and failed to log in. Monitoring lets you:
- Get alerted immediately during failures
- Observe performance degradations
- Monitor database load and memory leaks
- Maintain SLA (Service Level Agreement)
Monitoring tools like Datadog, New Relic, and Grafana enable a proactive approach to system health. You get graphs, anomaly detection, and predictive alerts, which all contribute to zero-downtime goals.
Choosing the Right Tool Combo
No single tool can cover everything perfectly. That’s why many developers combine tools. A common setup might look like:
- Winston or Pino for app-level logging
- ELK or Graylog for log aggregation and search
- Prometheus + Grafana for metrics monitoring
- Sentry for error tracking
- Datadog or New Relic for unified APM
The key is to balance granularity, ease of use, and budget. Some tools (like ELK) require self-hosting, while others (like Datadog) are SaaS-based and may have pricing limitations for startups. Simplify error tracking across your web stack by hiring a full stack engineer with experience in integrating latest tools and technologies for error tracing.
Security and Compliance
Logs often contain sensitive data—usernames, emails, IPs, sometimes even passwords if not filtered properly. Monitoring tools might be responsible for personal identifiers. Hence, compliance with GDPR, HIPAA, or SOC2 becomes a critical consideration.
Implement best practices such as:
- Masking sensitive data in logs
- Role-based access to monitoring dashboards
- Encrypted log transmission
- Retention policies and auto-deletion
Best Practices for Logging & Monitoring in NodeJS
- Log Levels: Use levels (info, warn, error, debug) to prioritize what gets logged.
- Correlation IDs: Assign a unique ID per request to trace across services.
- Log Rotation: Prevent disk overflow with tools like logrotate or Winston’s built-in transports.
- Distributed Tracing: Tools like Jaeger or OpenTelemetry can connect logs, metrics, and traces across services.
- Health Endpoints: Always have /health and /metrics endpoints for monitoring tools to ping.
Future Trends in Observability for NodeJS
- OpenTelemetry: An open-source project to unify logs, metrics, and traces. More and more tools are adopting it.
- AI in Monitoring: Tools like Datadog and Dynatrace now use ML to predict issues before they happen.
- Serverless Observability: As serverless gains traction, monitoring solutions are adapting to track ephemeral workloads.
- Edge Logging: With CDN-based or edge-deployed NodeJS (e.g., Cloudflare Workers), logging from distributed edge locations becomes the next challenge.
- Compliance-First Monitoring: With rising data privacy regulations, observability tools are adding compliance-focused features.
Conclusion
Robust logging and monitoring aren't just technical utilities—they're strategic enablers. They allow faster deployment, smarter debugging, better user experience, and more confidence in your product’s reliability. In high-scale NodeJS applications where milliseconds and megabytes matter, having real-time insight is the difference between a seamless user experience and losing users to frustration. Powerful dashboards for visual log tracking is always a best choice for preventing any software issues and ReactJS developers specializing in creating dashboard UIs are preferred.
Investing time in setting up a scalable observability stack will pay dividends in the long run—whether it's identifying a memory leak before it takes down your app or alerting your team when a third-party API slows down.