Node.js has revolutionized backend development with its non-blocking I/O model and event-driven architecture, making it ideal for building scalable server-side applications. However, with scalability comes complexity, and monitoring Node.js applications becomes crucial to ensure performance, availability, and reliability.
But with great power comes great responsibility — especially when it comes to monitoring performance in production. Node.js may be fast, but it's not immune to bottlenecks, memory leaks, or slow response times. That’s why Node.js monitoring is essential to ensure optimal application health, performance, and uptime.
Top Server Monitoring Tools for NodeJS Apps
1. New Relic
New Relic is a comprehensive application performance monitoring (APM) tool tailored for modern web applications, including NodeJS. It offers real-time insights into transactions, error rates, memory usage, and external service interactions. From CI/CD to cloud, you can streamline operations with DevOps engineers for keeping the application running smoothly.
Key Features:
- End-to-end tracing for NodeJS apps
- Custom dashboards and alerts
- Error tracking with stack traces
- Infrastructure and database monitoring
2. Datadog
Datadog is a popular cloud monitoring platform with strong NodeJS support. It provides detailed metrics, logs, and traces to help you understand your app’s health. You can go for Flutter developers for crafting smooth mobile apps and publishing the application to multiple stores with single codebase.
Key Features:
- Distributed tracing for microservices
- CPU, memory, and I/O metrics
- Auto-instrumentation for NodeJS
- Log management and analytics
3. Dynatrace
Dynatrace uses AI-powered analytics to deliver observability for cloud-native applications. It supports full-stack monitoring, including NodeJS runtime behavior. You can engage with our skilled ReactJS developers to build modern interfaces and seamless UI experiences.
Key Features:
- Real-time AI-assisted issue detection
- Smart dashboards
- Code-level performance monitoring
- Automatic dependency mapping
4. AppDynamics
Backed by Cisco, AppDynamics delivers enterprise-grade APM with support for NodeJS and other environments.
Key Features:
- Business transaction monitoring
- Code-level diagnostics
- Dynamic baselining
- Alerting and analytics
5. PM2 + PM2.io
PM2 is a widely used process manager for NodeJS, and when paired with PM2.io, it offers real-time monitoring and management capabilities.
Key Features:
- Process management (restart, cluster mode)
- CPU/memory usage tracking
- Real-time logging
- Remote monitoring with PM2.io
6. Elastic APM (ELK Stack)
Elastic APM is part of the Elastic Stack and integrates seamlessly with Kibana, Logstash, and Elasticsearch.
Key Features:
- Transaction-level visibility
- Performance bottleneck detection
- Custom metrics and logs
- Integration with existing ELK Stack
7. Prometheus + Grafana
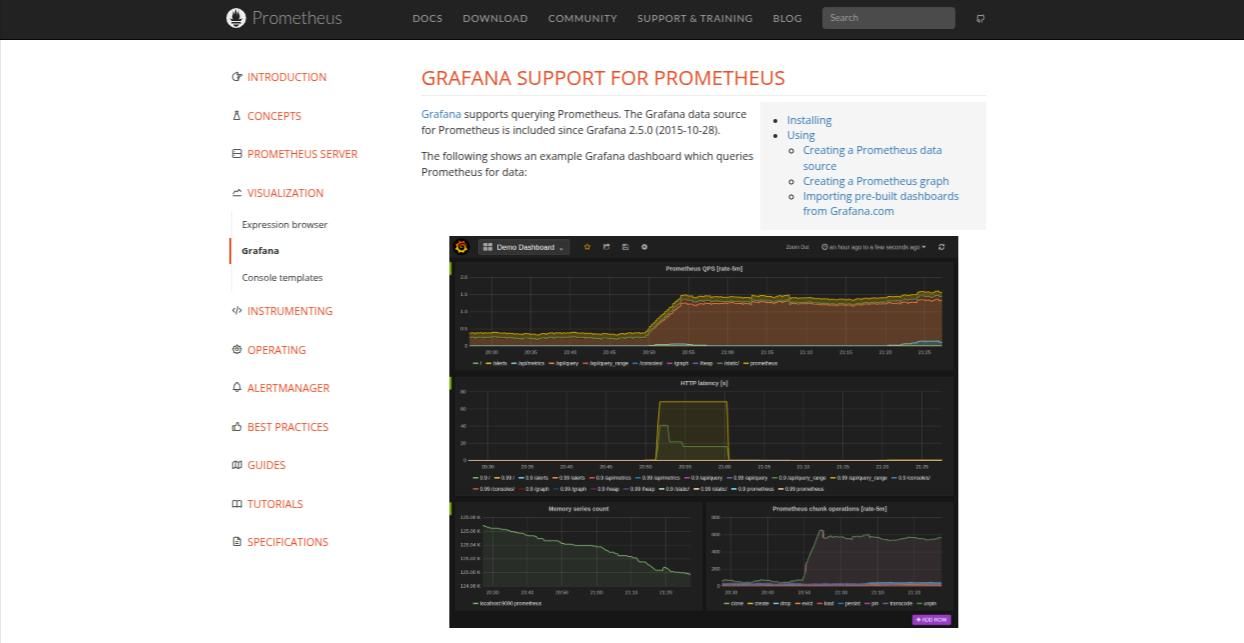
A classic open-source combination for time-series metrics and visual dashboards, highly customizable for NodeJS.
Key Features:
- Pull-based metrics collection
- Alerting with Alertmanager
- Visual dashboards via Grafana
- Exporters available for NodeJS metrics
8. SigNoz
SigNoz is an open-source APM tool built specifically as a modern alternative to proprietary systems.
Key Features:
- Supports OpenTelemetry
- Trace and log correlation
- NodeJS instrumentation
- Self-hosted and cloud options
9. Sentry
Sentry is best known for error tracking, but it also provides performance monitoring for NodeJS applications.
Key Features:
- Real-time crash reporting
- Transaction performance monitoring
- Breadcrumbs and stack traces
- Lightweight SDK
10. Scout APM
Scout APM is tailored for developers who want a simple and intuitive interface for performance monitoring.
Key Features:
- Detailed endpoint breakdowns
- N+1 query detection
- Memory bloat alerts
- GitHub integration
11. Instrumental

Instrumental provides high-resolution metrics with a minimal footprint, making it ideal for real-time monitoring.
Key Features:
- 1-second resolution metrics
- Real-time dashboards
- NodeJS monitoring agent
- Scalable for high-volume apps
12. StatusCake

Although primarily an uptime monitoring tool, StatusCake integrates well with backend servers for basic health and availability tracking.
Key Features:
- HTTP, TCP, and DNS checks
- Alerts via email, Slack, or webhook
- Custom test intervals
- NodeJS compatibility through integrations
13. Zabbix
Zabbix is a powerful open-source infrastructure monitoring tool, capable of monitoring NodeJS environments via custom scripts.
Key Features:
- Customizable dashboards
- Event correlation
- Built-in alerting
- SNMP and IPMI support
14. Checkmk
Checkmk is another open-source solution that excels in hybrid infrastructure monitoring.
Key Features:
- Agent-based and agentless monitoring
- NodeJS support via plugin
- Dynamic dashboards
- SLA reporting
15. Netdata
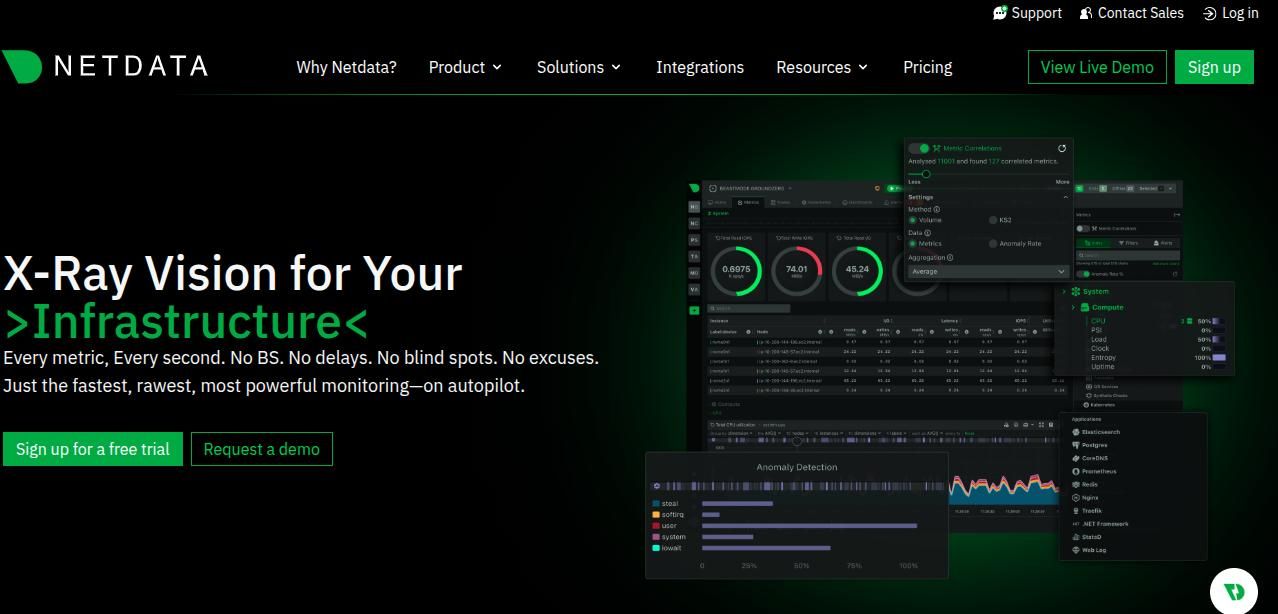
Netdata provides highly detailed real-time metrics visualization with minimal setup.
Key Features:
- Per-second monitoring
- Lightweight agent
- NodeJS-specific metrics
- Interactive visualizations
16. Site24x7
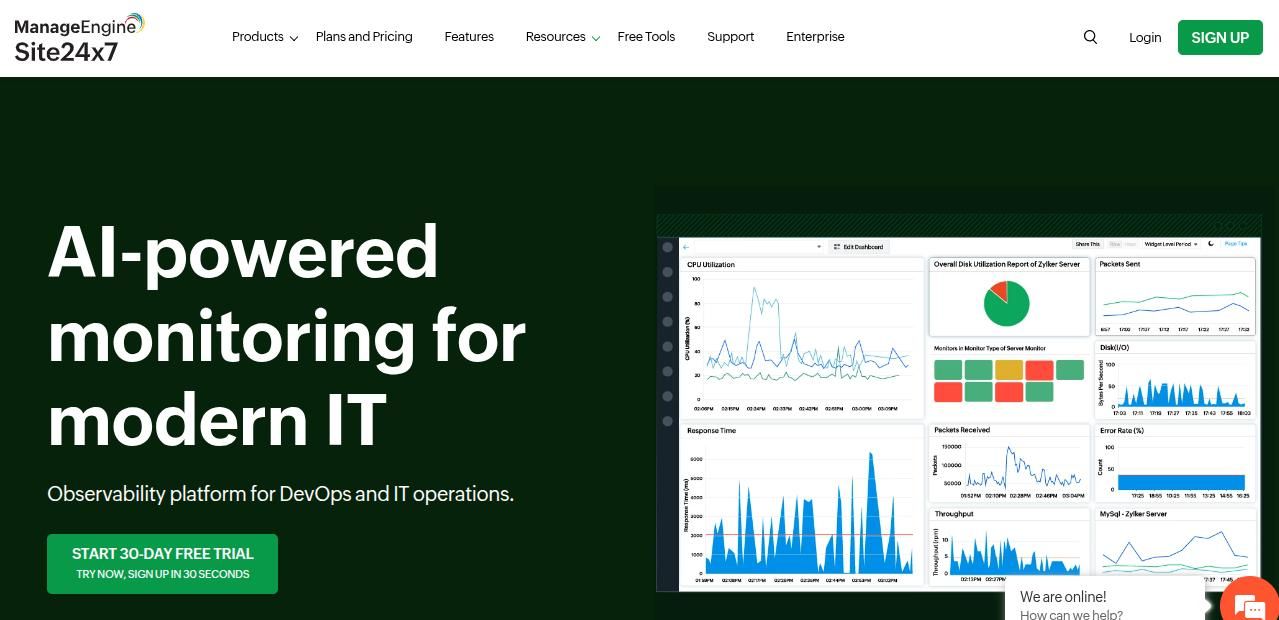
Site24x7, from Zoho, provides full-stack monitoring including NodeJS application performance.
Key Features:
- APM with real user monitoring (RUM)
- Application tracing
- Server and network monitoring
- Integration with CI/CD tools
17. UptimeRobot

Ideal for simple and effective uptime monitoring of NodeJS services.
Key Features:
- 1-minute check intervals
- REST API support
- Alerting via email, SMS, Slack
- Status pages
18. N|Solid by NodeSource
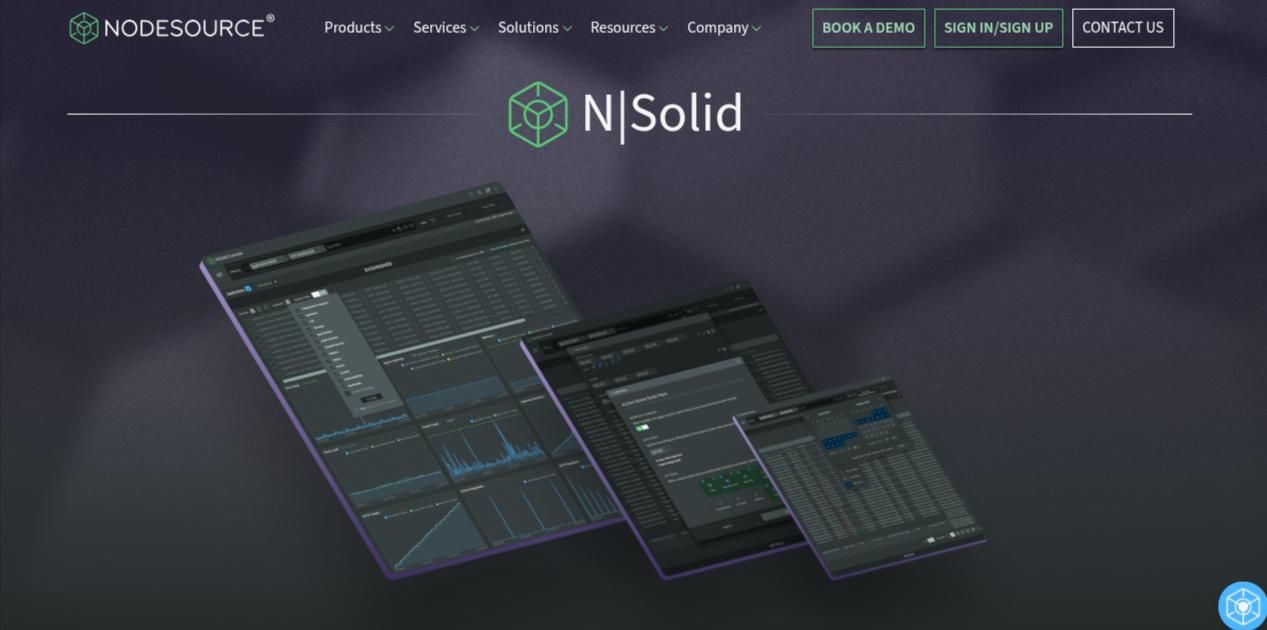
N|Solid is a NodeJS-specific monitoring solution built by NodeSource, providing deeper insights than general-purpose tools. Depending on the project requirements, experienced PHP developers helps to provide faster development cycles and efficient development workflow.
Key Features:
- Advanced CPU profiling
- Heap snapshot and garbage collection tracking
- Security vulnerability detection
- DevOps and DevSecOps integrations
19. LogRocket
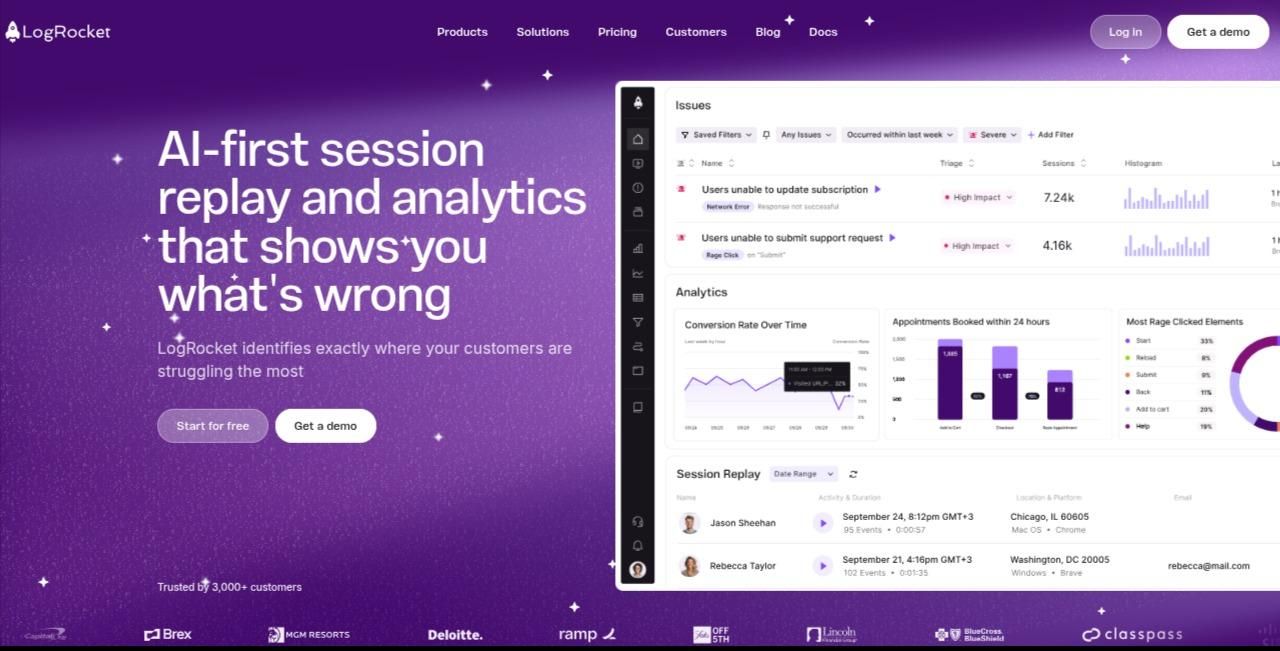
While more frontend-focused, LogRocket can trace performance issues from frontend to backend, including NodeJS servers. The angularJS is used by big tech giants, MEAN stack developers helps to speed up your application and ensure scalability.
Key Features:
- Session replay and error logging
- Backend performance tracing
- Integration with ExpressJS
- Real user monitoring
20. Raygun
Raygun offers crash reporting and APM tailored to modern development stacks including NodeJS. NodeJS developers creates high-performance server-side apps for reliable backend functionality of you projects.
Key Features:
- Performance insights at the code level
- Real-time error tracking
- Deployment tracking
- Intelligent alerting
How to Choose the Right NodeJS Monitoring Tool?
When selecting the best tool for your NodeJS app, consider:
- Type of Monitoring: Full-stack, APM, log-based, or infrastructure.
- Ease of Setup: Some tools are plug-and-play; others require manual instrumentation.
- Scalability: Can the tool grow with your app?
- Real-time Capabilities: How fast can it detect and report issues?
- Budget: Many tools offer free tiers, but advanced features often require subscriptions.
Conclusion
In today's digital-first world, application downtime, slow response times, or undetected memory leaks can quickly erode user trust and cause significant revenue loss. This is especially true for NodeJS applications, which are often used for high-concurrency environments like APIs, real-time apps, and microservices. As such, monitoring is no longer optional—it’s a mission-critical part of your DevOps pipeline. There are several NodeJS monitoring apps for increasing the productivity of backend teams and ensuring faster development cycles. Choosing the right monitoring tool depends on multiple factors: your project scale, team size, preferred deployment model (self-hosted or SaaS), and, of course, your budget. Some tools like New Relic, Datadog, and AppDynamics offer robust enterprise-level solutions ideal for large teams with complex architectures.
On the other hand, PM2, Netdata, and Prometheus + Grafana are excellent open-source or low-cost alternatives that still offer powerful monitoring capabilities for smaller teams or individual developers. These are especially valuable when you want a higher level of customization or are operating under strict compliance policies that restrict third-party cloud usage