Errors in modern applications don’t just break features—they break trust. A single unhandled exception or unnoticed crash can ruin the user experience and impact revenue. This is why error monitoring tools have become integral to the developer workflow. They provide real-time insights into bugs, crashes, and exceptions before users ever notice them.
Today’s error monitoring landscape is rich with options that go beyond logging—they integrate deeply with CI/CD pipelines, alerting systems, and project management tools. We will explore best error monitoring tools available for developers and DevOps teams, evaluating their capabilities, integrations, and use cases to help you make an informed choice.
1. Rollbar
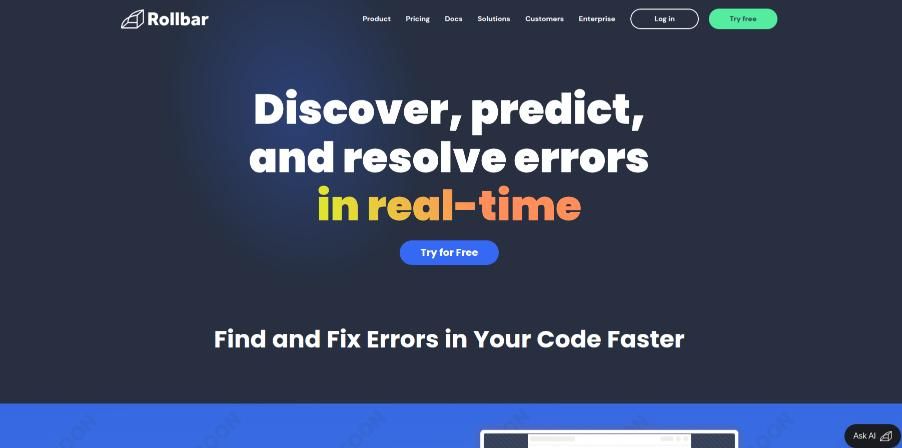
Rollbar provides real-time error monitoring with full-stack support across multiple languages and frameworks. It offers automated grouping, root cause analysis, and seamless integration with CI/CD pipelines. Its intuitive interface and proactive alerting system make it ideal for teams seeking comprehensive error tracking. Rollbar helps developers reduce mean time to resolution (MTTR) by providing contextual error information and detailed diagnostics. Its integrations with Slack, Jira, GitHub, and other tools ensure errors are tracked and resolved efficiently without interrupting workflows.
Key Features
- Real-time error detection and alerting
- Full-stack support for multiple languages
- Automated error grouping and root cause analysis
- Seamless CI/CD integration
2. Sentry
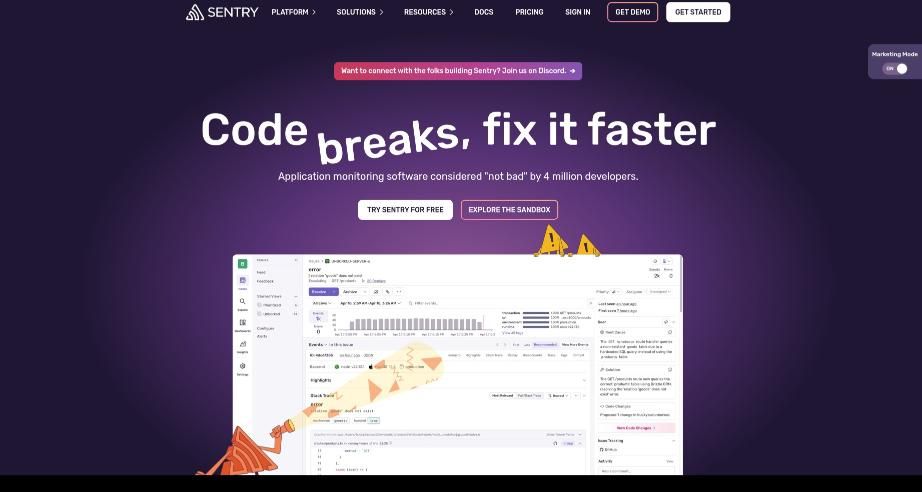
Sentry is a widely-used error tracking platform providing real-time crash reporting and performance monitoring. It delivers detailed context for each error, including stack traces, user impact, and environment data. Developers can quickly reproduce, debug, and resolve issues across multiple platforms and languages. Sentry also offers integration with GitHub, GitLab, Slack, and Jira, making it easy for teams to streamline incident management. Its performance monitoring capabilities allow teams to analyze bottlenecks alongside errors, providing a holistic view of application health.
Key Features
- Real-time crash reporting
- Detailed error context with stack traces
- Performance monitoring capabilities
- Multi-language support
3. Raygun

Raygun offers real-time error monitoring and crash reporting focused on improving user experience. It provides detailed diagnostics, automatic grouping, and root cause analysis to help teams quickly fix problems. Raygun supports web, mobile, and backend platforms. By combining error monitoring with performance metrics, Raygun helps teams detect issues that affect users before they escalate. Its alerting system and customizable dashboards ensure developers can focus on resolving critical errors efficiently.
Key Features
- Real-time error monitoring and crash reporting
- Detailed diagnostics and root cause analysis
- Web, mobile, and backend support
- User experience-focused insights
4. LogRocket
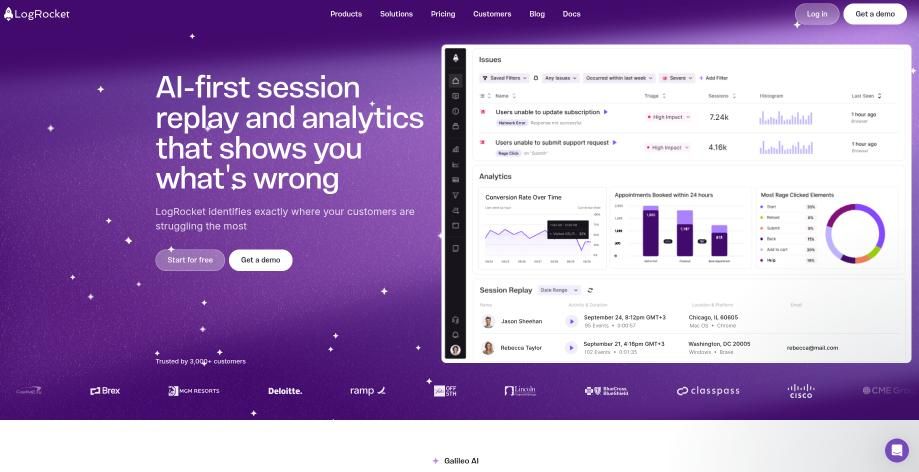
LogRocket combines error tracking with session replay, allowing teams to see exactly what users experienced during an error. It provides performance monitoring and analytics, helping teams understand the impact of issues on user behavior. Its frontend focus is ideal for web applications, and it integrates easily with tools like Redux, Vuex, and Angular. LogRocket’s analytics help prioritize fixes by showing how errors affect user engagement and conversions.
Key Features
- Session replay for UX insights
- Error tracking and performance monitoring
- Frontend application focus
- User behavior analytics
5. Better Stack
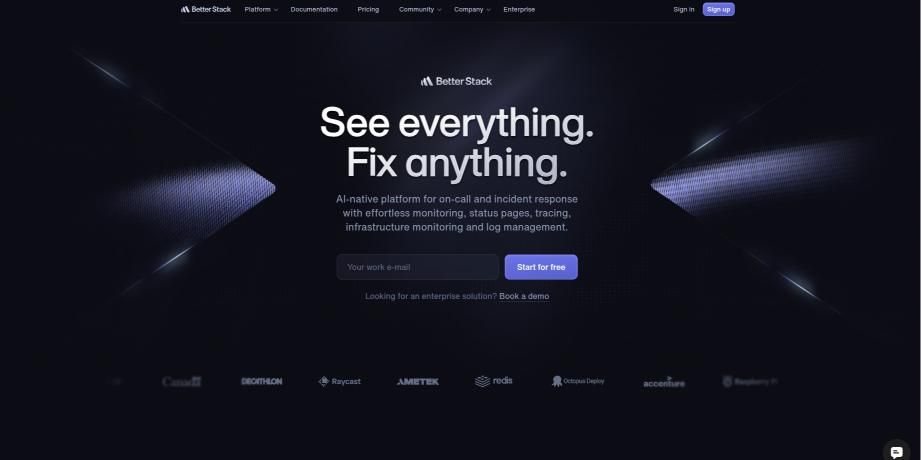
Better Stack is an open-source error tracking solution emphasizing simplicity and performance. It offers real-time detection, alerting, and detailed context for resolving errors efficiently. It’s lightweight, self-hosted, and suitable for teams prioritizing privacy and cost-effectiveness. Better Stack’s minimalistic interface reduces setup complexity while providing actionable insights. Its notification system integrates with email, Slack, and webhooks, ensuring errors are addressed immediately.
Key Features
- Open-source and self-hosted
- Real-time error detection and alerting
- Detailed error context
- Lightweight and performant
6. Datadog
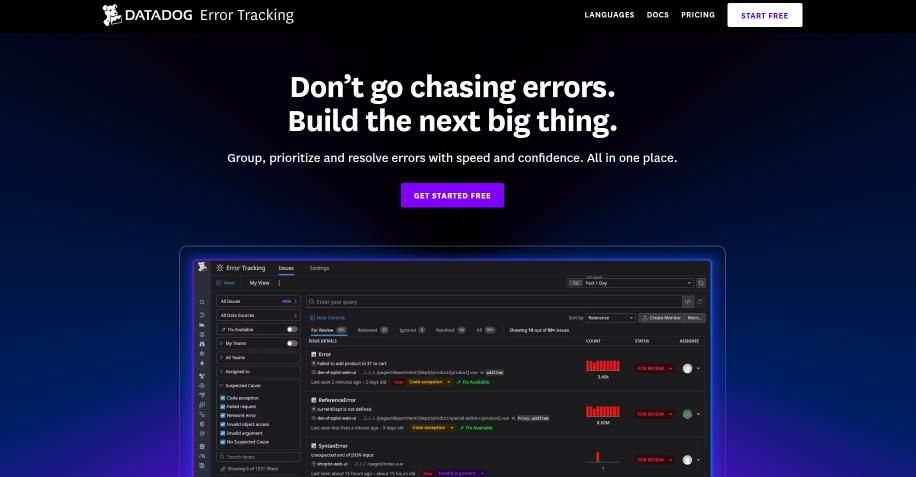
Datadog is a full-stack monitoring platform that includes error tracking. It offers real-time alerting, detailed analytics, and integrations with cloud services like AWS, Azure, and GCP. Datadog is perfect for teams needing an all-in-one monitoring solution. Its dashboards provide a unified view of logs, metrics, and traces, enabling developers to detect anomalies quickly. Datadog’s observability features also help track dependencies across distributed architectures.
Key Features
- Full-stack monitoring and analytics
- Real-time alerting
- Cloud service integrations
- Comprehensive observability suite
7. AppSignal
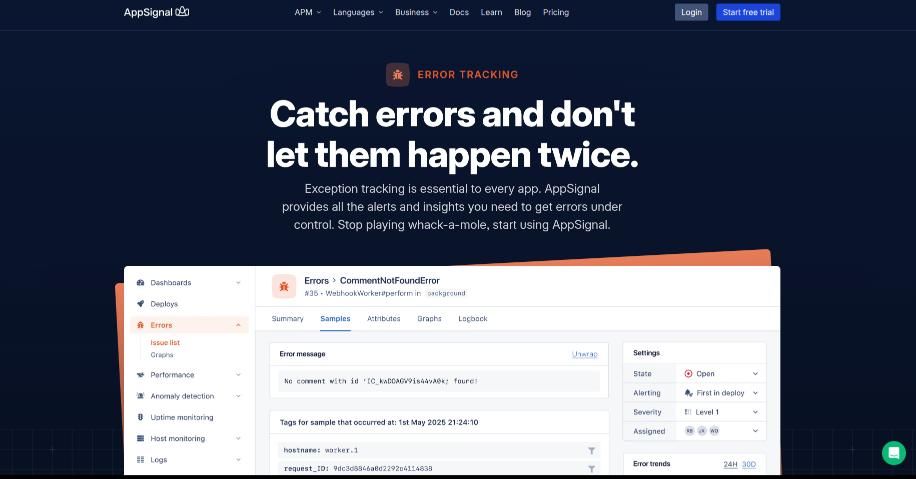
AppSignal provides performance monitoring and error tracking for Ruby on Rails and Elixir/Phoenix applications. It offers detailed performance metrics, error monitoring, and host-level insights to ensure application stability. It simplifies debugging by visualizing errors alongside request traces and performance metrics. AppSignal’s dashboards are intuitive, making it easy for developers to pinpoint bottlenecks and optimize app performance.
Key Features
- Performance monitoring and error tracking
- Focus on Ruby on Rails and Elixir/Phoenix
- Detailed performance metrics
- Host metrics monitoring
8. Airbrake
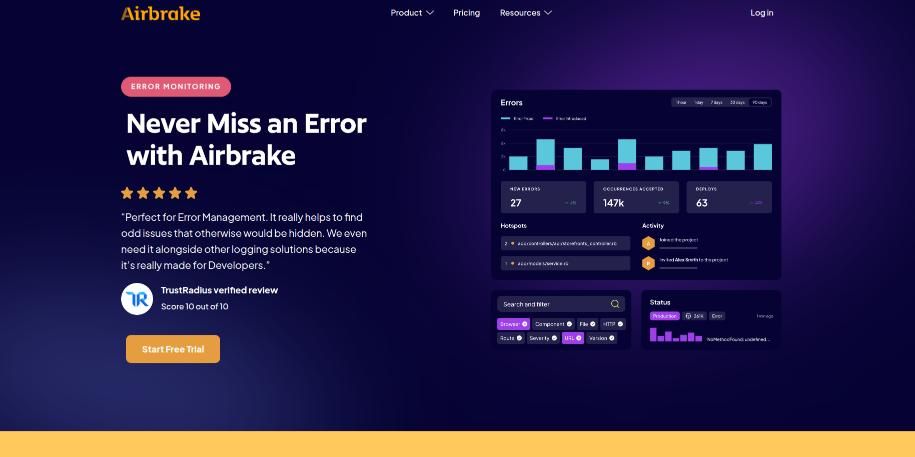
Airbrake provides real-time error tracking and detailed diagnostics. It supports multiple languages and integrates with popular development tools, making it suitable for teams wanting straightforward error monitoring. Airbrake’s notifications help teams fix errors quickly and maintain high uptime. It also tracks error trends over time, helping developers identify recurring issues and prevent future failures.
Key Features
- Real-time error alerts
- Detailed diagnostics
- Multi-language support
- Integration with development tools
9. Honeybadger
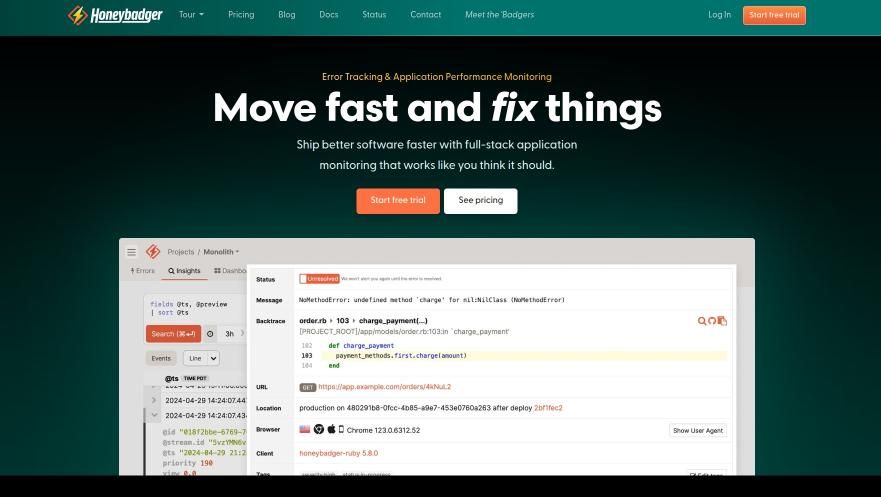
Honeybadger offers real-time error monitoring, alerts, and detailed error reports. It supports multiple programming languages and provides insights into application health. Its integrated uptime monitoring adds an extra layer of reliability. Honeybadger helps development teams track errors without adding significant overhead. Its detailed reports allow developers to quickly identify and resolve issues impacting users.
Key Features
- Real-time error alerts
- Detailed error reports
- Multi-language support
- Application health insights
10. GlitchTip
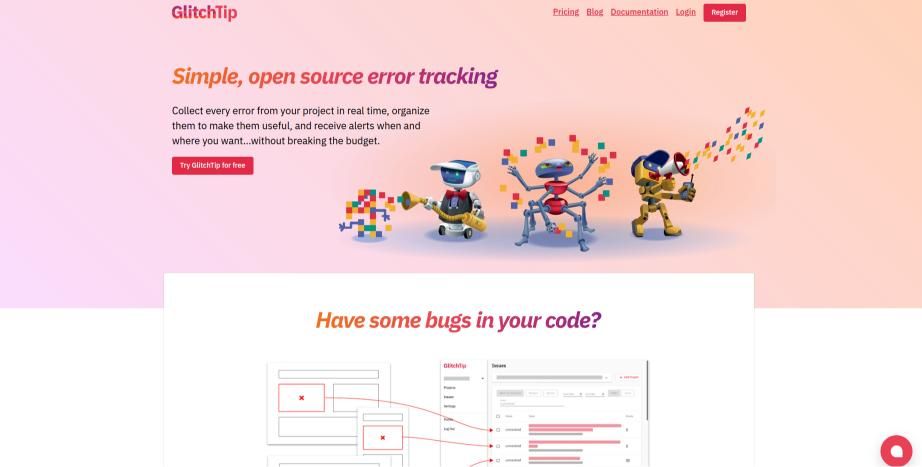
GlitchTip is an open-source error tracking platform compatible with Sentry SDKs. It offers real-time detection, grouping, and alerting, providing a lightweight, privacy-focused solution. GlitchTip is suitable for cost-conscious, self-hosted teams. It enables developers to monitor errors efficiently without relying on third-party cloud services. GlitchTip’s dashboards provide clear insights into errors, making it easy to prioritize and resolve issues.
Key Features
- Open-source and self-hosted
- Sentry SDK compatibility
- Real-time error detection and alerting
- Lightweight and privacy-focused
Comparison of the tools: Pros, Cons, and Ideal Use Cases
| Tool | Ideal Use Case | Pros | Cons |
| Rollbar | Full-stack error monitoring | Real-time insights, CI/CD integration | Pricing high for small teams |
| Sentry | Detailed error context & performance | Rich error context, integrations | Setup complexity |
| Raygun | UX-focused error tracking | Multi-platform support, UX insights | Extra configuration |
| LogRocket | Frontend UX & session replay | Session replay, behavior analytics | Limited backend monitoring |
| Better Stack | Open-source, self-hosted solutions | Lightweight, cost-effective | Self-hosting required |
| Datadog | All-in-one monitoring & observability | Full-stack visibility, cloud integration | Expensive |
| AppSignal | Ruby on Rails / Elixir apps | Framework-specific support, actionable insights | Limited other frameworks |
| Airbrake | Simple multi-language error tracking | Easy setup, multi-language | Basic features |
| Honeybadger | Reliable multi-language error monitoring | Reliable, app insights | Limited advanced features |
| GlitchTip | Cost-effective, privacy-focused | Open-source, lightweight | Fewer integrations |
Conclusion
Selecting the right error monitoring tool depends on your team’s needs, tech stack, and budget. Full-stack solutions like Rollbar and Sentry provide detailed insights, while open-source platforms like GlitchTip and Better Stack cater to cost-conscious, self-hosted setups. Using an appropriate tool reduces downtime, improves user experience, and ensures application reliability, ultimately making your software robust and future-ready. Choosing the right error monitoring tool depends on your stack, team size, and priorities. As web and mobile apps become more complex, error monitoring has shifted from reactive to proactive. The best approach is to pick a tool that not only identifies issues but also contextualizes them in real time—helping teams deliver flawless, user-first experiences.