Top Observability Tools for Modern Cloud Applications | Dappinity

Top Observability Tools for Modern Cloud Applications | Dappinity

Observability is no longer optional for modern cloud applications. While traditional monitoring shows system health, observability gives deep insight into metrics, logs, and traces, helping teams proactively troubleshoot and optimize performance. Distributed architectures, microservices, and serverless apps make observability critical. Choosing the right tools ensures your systems are reliable, scalable, and maintainable. 

With observability tools, developers have to debug less and boost productivity. The DevOps teams working on microservices and distributed systems get clear insights into the system's overall working for better outputs and to provide the application system with better failure tolerance. We will delve into the top observability tools for enterprises, open-source users, and specialized scenarios.

Open-Source observability tools

Prometheus

Prometheus - obserability

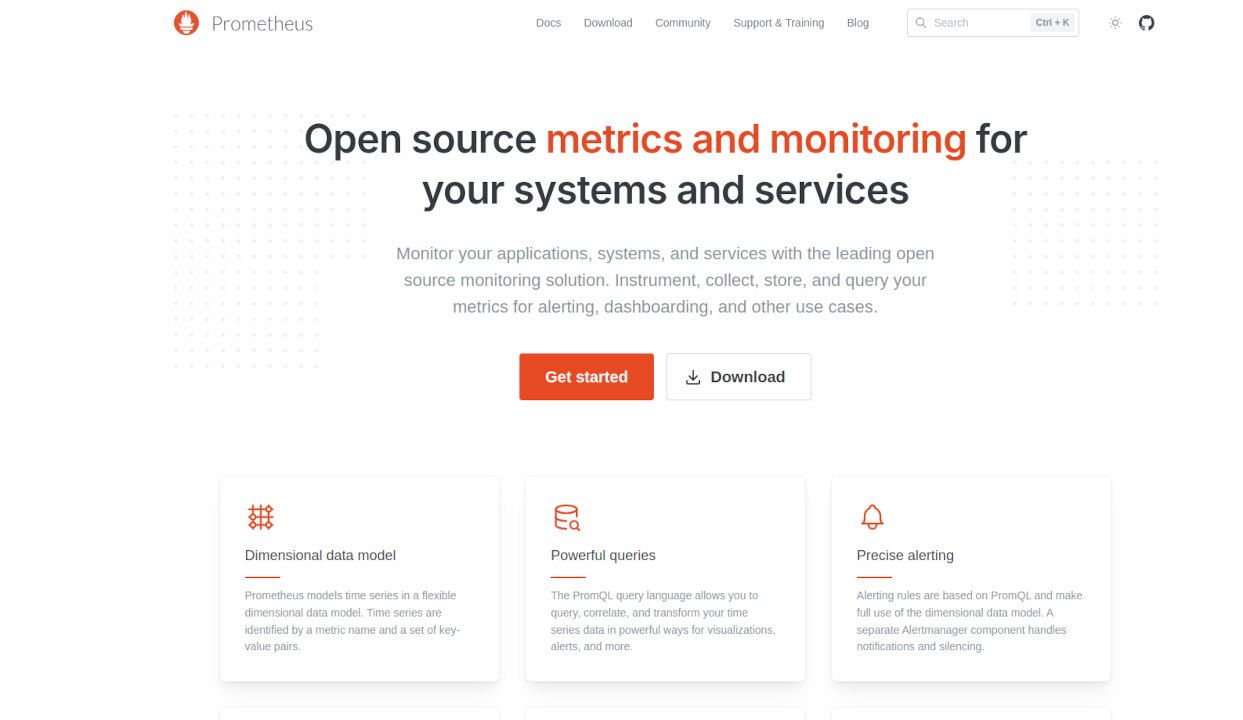
Prometheus is an open-source monitoring and alerting toolkit designed for cloud-native environments. It collects time-series metrics, supports multi-dimensional data models, and provides powerful query language (PromQL) for analysis.

Prometheus integrates well with Kubernetes, Docker, and microservices, enabling teams to monitor performance efficiently. With flexible alerting rules and visualization through Grafana, it helps teams identify issues proactively and optimize resources.

ProsCons
Cloud-native and Kubernetes-friendlyLimited native dashboarding (requires Grafana)
Powerful query language (PromQL)Can be complex for beginners
Flexible alerting and metric collectionScaling to very large environments requires extra effort

Grafana

grafana

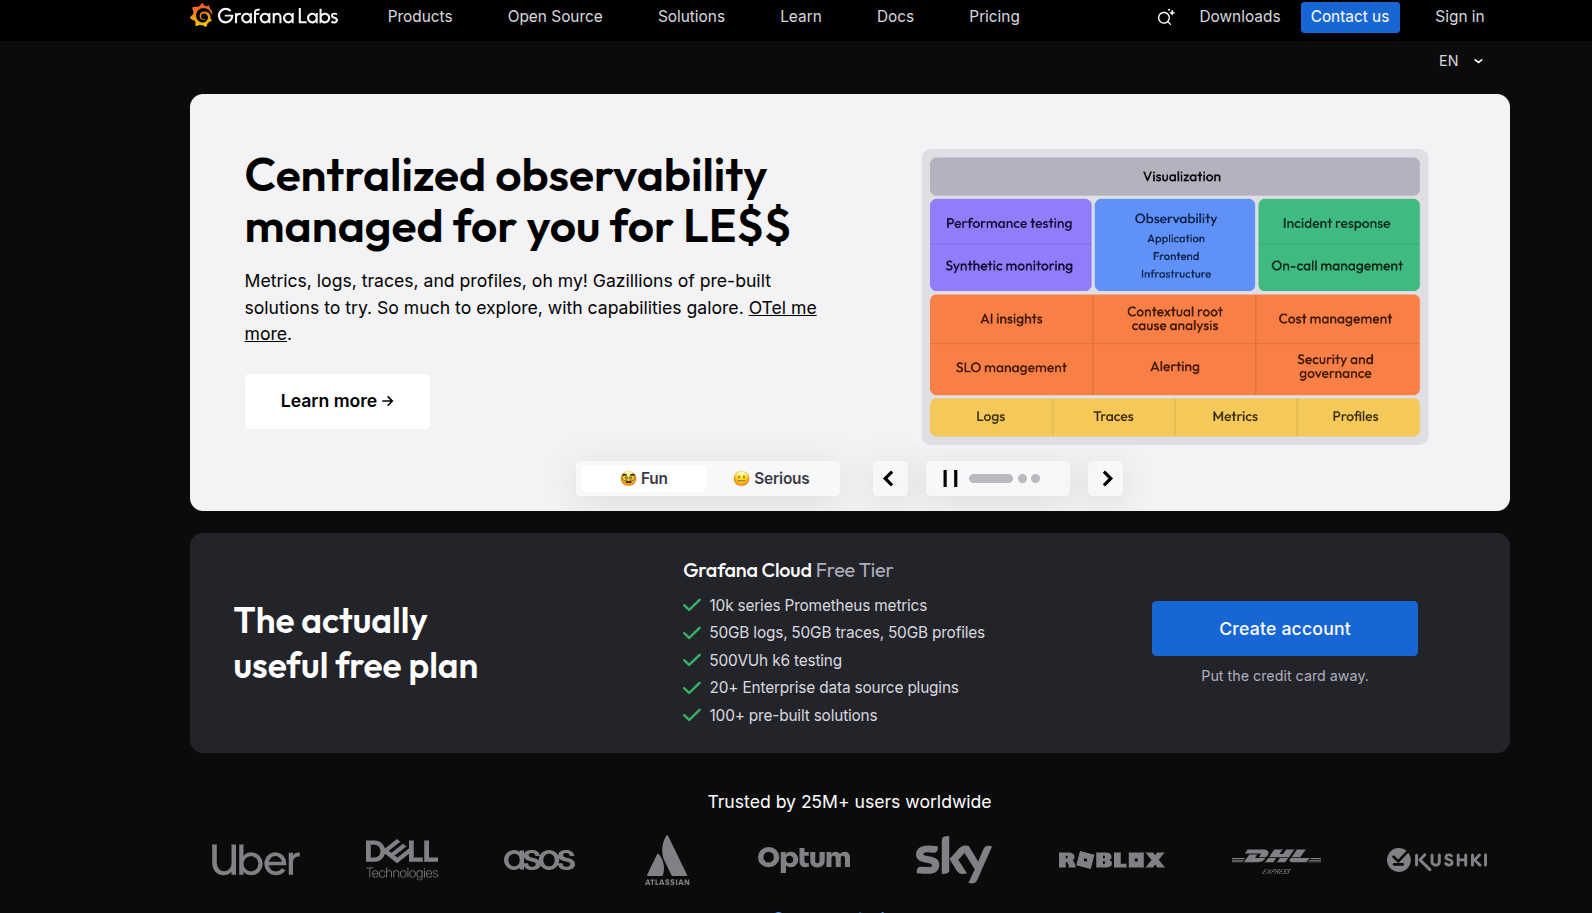
Grafana is an open-source visualization platform for metrics, logs, and traces. It allows teams to create interactive dashboards, monitor KPIs, and integrate data from multiple sources like Prometheus, Loki, and Elasticsearch.

It supports alerting and sharing dashboards across teams, improving collaboration. Grafana’s plugins and templating make it easy to customize dashboards for different environments, from small apps to large cloud deployments.

ProsCons
Highly customizable dashboardsRequires setup and configuration for data sources
Integrates with many metrics/log sourcesSome advanced features require Grafana Enterprise
Supports alerting and team collaborationSteeper learning curve for non-technical users

Jaeger

jaeger observability

Jaeger is an open-source distributed tracing tool that helps developers understand system performance and latency across microservices. It enables root cause analysis, service dependency tracking, and performance optimization.

It integrates with OpenTelemetry, Kubernetes, and cloud-native platforms, making it ideal for modern cloud applications. Jaeger helps teams detect bottlenecks, optimize resource allocation, and improve user experience.

ProsCons
Open-source and free to useLimited visualization compared to commercial tools
Excellent for distributed tracingRequires integration with other observability tools
Integrates with OpenTelemetry and cloud platformsCan be complex for beginners

OpenTelemetry

openTelemetry observability

OpenTelemetry is an open-source observability standard that collects metrics, logs, and traces from applications and infrastructure. It provides a vendor-neutral framework, allowing teams to switch or combine tools without losing instrumentation.

By standardizing telemetry, OpenTelemetry reduces vendor lock-in and improves cross-platform observability. Developers can instrument applications once and export data to multiple backends like Datadog, Prometheus, or Grafana.

ProsCons
Vendor-neutral and flexibleRequires setup and understanding of instrumentation
Supports metrics, logs, and tracesSome backends may require additional configuration
Reduces vendor lock-inAdvanced features may need developer expertise

Enterprise leaders observability tools

Datadog

datadog observability

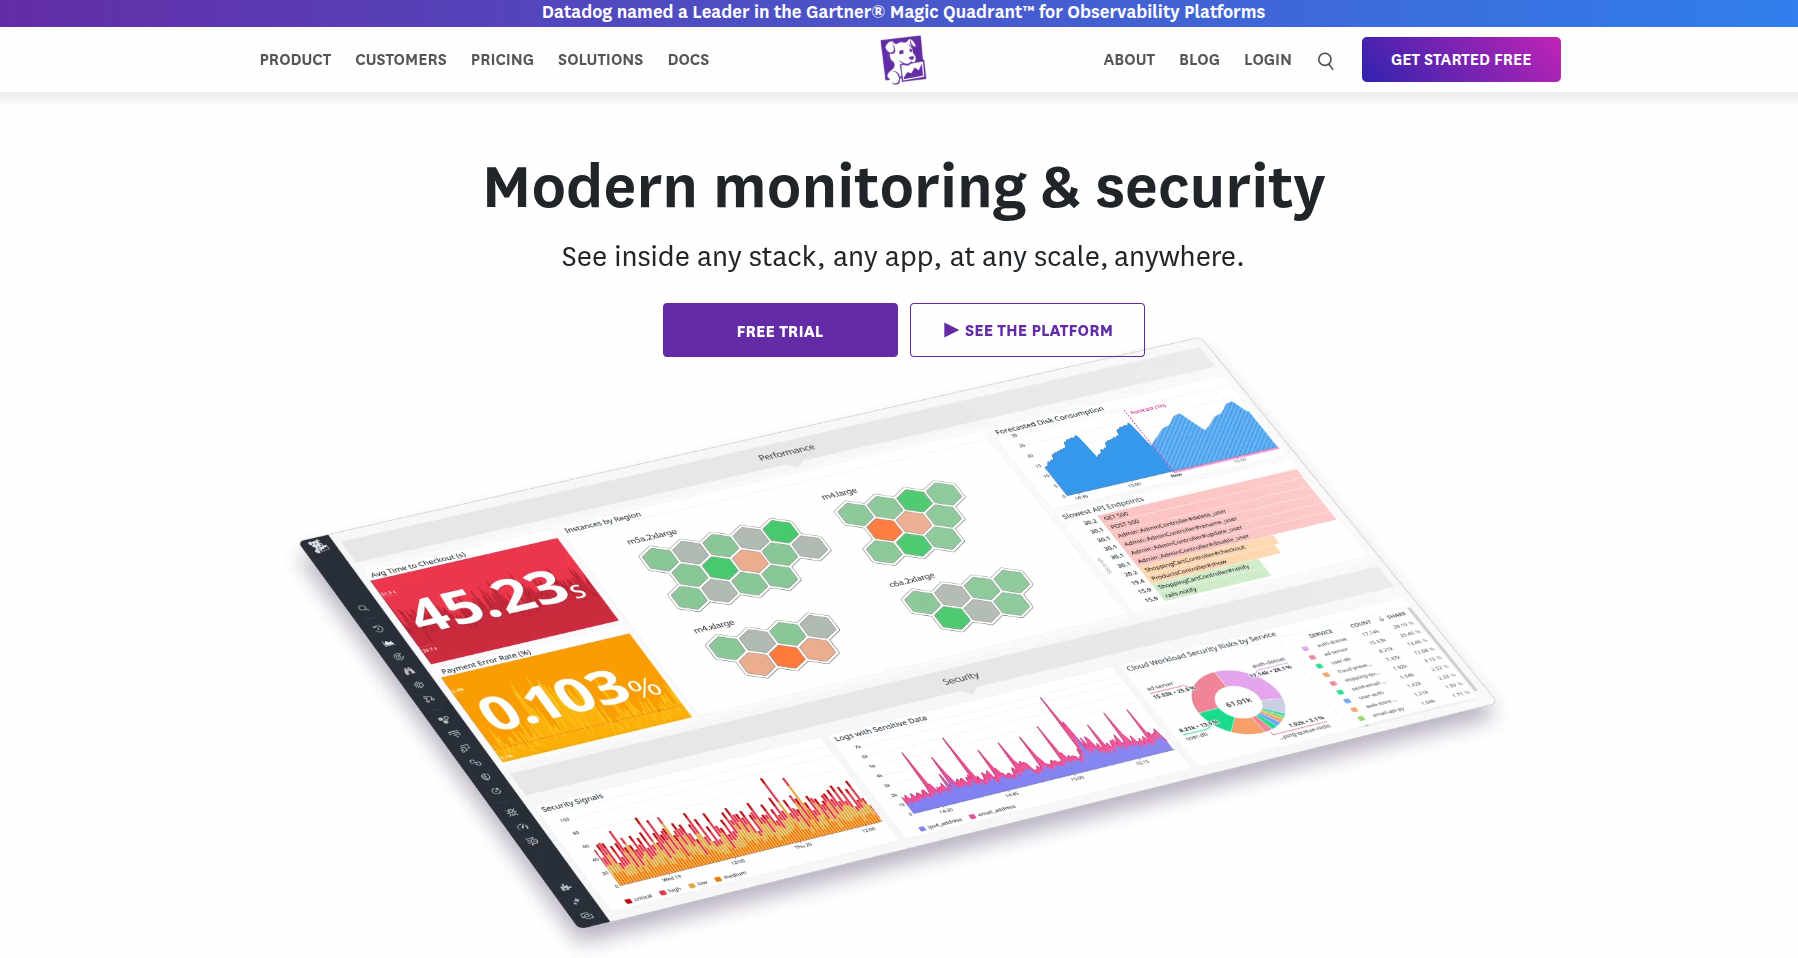
Datadog is a comprehensive observability platform that unifies metrics, logs, traces, and security monitoring. It supports hybrid and multi-cloud environments, making it ideal for modern cloud applications. Its AI-powered alerts help teams detect anomalies proactively, reducing downtime.

Datadog integrates with over 450 technologies, including Kubernetes, AWS, Azure, and serverless platforms. Teams can create custom dashboards and automated reports, improving visibility across complex systems. Its intuitive interface allows developers and operations teams to collaborate effectively on performance issues.

ProsCons
All-in-one platform for metrics, logs, tracesCan be expensive for small teams
Strong cloud-native support & integrationsSlight learning curve for new users
AI-powered alerts for proactive monitoringHigh data ingestion costs for large environments

New Relic

newRelic observability

New Relic provides end-to-end observability with application performance monitoring, telemetry, and real-time analytics. Its developer-first approach supports fast debugging and deployment, making it popular for cloud-native teams. The platform integrates seamlessly with OpenTelemetry, enabling vendor-neutral telemetry collection.

It offers full-stack dashboards and advanced analytics, helping teams identify bottlenecks and latency issues quickly. With anomaly detection and AI-driven insights, New Relic reduces manual troubleshooting effort and accelerates incident response for distributed systems.

ProsCons
Developer-first approach with full-stack visibilityCan be complex for beginners
Integrates with OpenTelemetry and multiple cloud platformsPricing can be high for full feature set
AI-powered analytics & anomaly detectionDashboards may require customization for complex apps

Dynatrace

dynatrace observability

Dynatrace leverages AI-driven automation to monitor application performance, infrastructure, and cloud environments. It is especially suited for large, distributed systems and microservices architectures. Root cause analysis is automated, helping teams resolve incidents faster.

With real-time observability, Dynatrace provides end-to-end insights into user experience, system dependencies, and resource utilization. Its continuous monitoring ensures performance optimization, even during peak traffic or deployments.

ProsCons
AI-driven root cause analysisEnterprise pricing can be high
Full-stack and cloud-native supportSteep learning curve for small teams
Excellent microservices & distributed system visibilityComplex initial setup

Specialized & popular obeservability tools

Honeycomb

honeycomb observability

Honeycomb is an observability tool that focuses on high-cardinality event data, helping teams debug production systems faster. It allows developers to explore complex interactions across microservices and identify issues that traditional monitoring may miss.

With its powerful query interface, Honeycomb enables deep investigation of anomalies and performance bottlenecks. Teams can create custom dashboards and charts to visualize system behavior, enhancing root cause analysis and reliability.

ProsCons
Excellent for high-cardinality event analysisPaid tool with enterprise pricing
Fast root cause analysis in complex systemsLearning curve for new users
Highly customizable dashboardsNot a full APM solution on its own

PagerDuty

pagerDuty observability

PagerDuty is designed for incident response and alerting, helping teams respond quickly to critical system events. It automates on-call rotations, escalations, and notifications, ensuring minimal downtime and faster resolution.

Integrating with existing monitoring and observability tools, PagerDuty streamlines incident workflows and reduces alert fatigue. Teams can track incidents, analyze response metrics, and continuously improve operational efficiency.

ProsCons
Automated on-call and alerting workflowsSubscription cost may be high for small teams
Integrates with major observability and monitoring toolsCan be complex to configure initially
Reduces alert fatigue and improves responseLimited metrics collection on its own

Moogsoft

moogsoft observability

Moogsoft uses AI and machine learning to detect anomalies, correlate events, and reduce noise in observability data. It helps IT teams identify the true root cause quickly, improving system reliability and uptime.

By integrating with metrics, logs, and alerts, Moogsoft reduces manual investigation effort. Its AIOps approach ensures that teams can focus on critical incidents while automating routine monitoring and event correlation.

ProsCons
AI-driven anomaly detectionEnterprise pricing can be high
Correlates events to reduce noiseMay require setup time and expertise
Improves MTTR and system reliabilityNot suitable as a standalone monitoring tool

BigPanda

bigPanda observability

BigPanda provides event correlation, alert aggregation, and AI-driven incident response. It helps teams consolidate alerts from multiple observability tools, reduce noise, and focus on real problems.

Its automated workflows and integrations with cloud-native stacks enhance incident management. Teams gain a centralized view of system health, reducing downtime and improving operational efficiency.

ProsCons
Event correlation reduces alert fatiguePricing may be prohibitive for small teams
AI-driven incident responseLimited direct metrics collection
Integrates with multiple monitoring toolsLearning curve for advanced features

Conclusion

Observability is a critical component of modern cloud applications, providing deep insights into metrics, logs, and traces that traditional monitoring alone cannot deliver. By leveraging enterprise leaders like Datadog, New Relic, and Dynatrace, teams gain full-stack visibility and AI-powered insights for complex, distributed systems. Open-source favorites such as Prometheus, Grafana, Jaeger, and OpenTelemetry offer flexibility, scalability, and vendor-neutral instrumentation, making them ideal for cloud-native and microservices environments. Specialized tools like Honeycomb, PagerDuty, Moogsoft, and BigPanda complement these solutions, helping teams detect anomalies, manage incidents, and reduce downtime efficiently.

Selecting the right combination of observability tools depends on team size, cloud strategy, and specific requirements. Enterprises may prioritize all-in-one platforms for end-to-end coverage, while startups or open-source advocates may favor Prometheus, Grafana, and Jaeger for cost-effective flexibility. Regardless of the choice, following best practices in instrumentation, alerting, and dashboarding ensures proactive monitoring, faster issue resolution, and optimized system performance. By adopting the right observability stack, teams can enhance reliability, improve user experience, and confidently scale modern cloud applications.

More Blogs

ChatOps Tools to Enhance Developer Collaboration | Dappinity

ChatOps Tools to Enhance Developer Collaboration | Dappinity

ChatOps integrates chat platforms with DevOps workflows, enabling developers to collaborate and execute tasks directly from messaging tools. These tools improve communication, automate routine tasks, and reduce context switching. By connecting pipelines, monitoring systems, and incident management into chat, teams can respond faster and work more efficiently. Adopting ChatOps tools ensures transparency, better coordination, and streamlined collaboration for modern development teams.

by ankit 5 March 2025
Ensuring UI Consistency with Visual Regression Testing Tools

Ensuring UI Consistency with Visual Regression Testing Tools

Visual regression testing ensures consistent UI experiences by automatically detecting unexpected design changes across browsers, devices, and updates before they impact users.

by manish 5 March 2025
Top CI/CD Tools for Scalable Web Apps

Top CI/CD Tools for Scalable Web Apps

Read how CI/CD streamlines code integration, testing, and deployment—boosting speed, quality, and scalability in modern software development.

by varsha 5 March 2025
Top AI Tools for Database Query Optimization and Monitoring

Top AI Tools for Database Query Optimization and Monitoring

Database performance is critical for modern applications, and AI tools are making optimization faster and smarter. They provide predictive insights, automated query tuning, and real-time monitoring. From simple AI2SQL recommendations to enterprise-grade SolarWinds analysis, these tools reduce manual effort. Teams can now maintain high performance, avoid bottlenecks, and ensure reliable user experiences with AI-powered database solutions.

by manish 5 March 2025
Top Low-Code and No-Code Platforms to Watch in 2025

Top Low-Code and No-Code Platforms to Watch in 2025

Low-code and no-code (LCNC) platforms are reshaping application development, enabling both developers and non-technical users to build faster and smarter. By 2025, they’re vital for digital transformation across industries. With AI integration, enterprise adoption, and improved security, LCNC tools support innovation at scale. Choosing the right platform empowers businesses to reduce costs, improve agility, and stay competitive in a rapidly evolving market.

by manish 5 March 2025
How Analyzing Log Patterns Transforms Debugging and Monitoring

How Analyzing Log Patterns Transforms Debugging and Monitoring

Analyzing log patterns turns raw system data into actionable intelligence, enabling faster debugging and predictive monitoring. Instead of firefighting after failures, teams gain context, uncover root causes, and detect anomalies before they escalate. From error clustering to capacity planning, pattern analysis strengthens security, performance, and compliance. By leveraging AI-driven tools, businesses can transform logs into a proactive strategy for resilience and customer trust.

by varsha 5 March 2025
Top 5 Emerging Software Testing Roles Every Product Company Needs

Top 5 Emerging Software Testing Roles Every Product Company Needs

Discover the top 5 emerging software testing roles every product company needs, from AI testing engineers to QAOps specialists, and boost product quality.

by varsha 5 March 2025
Top AI Tools for Progressive Web App Performance Optimization

Top AI Tools for Progressive Web App Performance Optimization

Progressive Web Apps are expected to deliver app-like experiences at web scale, but optimizing performance can be complex. AI-powered tools provide automated monitoring, predictive insights, and actionable recommendations for load speed, caching, and responsiveness. By leveraging these tools, developers can ensure a seamless user experience while reducing manual tuning effort. The right AI solutions make PWAs faster, smarter, and more reliable.

by ankit 5 March 2025
Pros and Cons of React Native for Modern Mobile App Developers

Pros and Cons of React Native for Modern Mobile App Developers

React Native has become a popular choice for building mobile apps, but it is not a one-size-fits-all solution. This in-depth guide explores its practical benefits, real limitations, and when it makes sense for modern mobile app developers.

by manish 5 March 2025
AI Tools for Accelerating Developer Ramp-Up and Productivity

AI Tools for Accelerating Developer Ramp-Up and Productivity

Onboarding and ramping up new developers can be time-consuming, but AI tools simplify the process. From GitHub Copilot’s smart code suggestions to Sourcegraph’s intelligent code search, these platforms help developers understand codebases and workflows quickly. Tools like LinearB, Codex, and Tabnine further enhance productivity by automating routine tasks and providing real-time guidance. AI-powered ramp-up ensures faster integration, reduced errors, and higher team efficiency.

by manish 5 March 2025
AWS Developer vs AWS DevOps Engineer

AWS Developer vs AWS DevOps Engineer

Discover the real difference between an AWS Developer and an AWS DevOps Engineer in 2025. This in-depth guide explains roles, skills, certifications, AWS CI/CD pipelines, IaC tools, salaries, career paths, and how to choose the right certification—Developer Associate vs DevOps Professional—based on your goals. Perfect for beginners, students, job seekers, and professionals planning AWS careers in India, the US, and globally.

by ankit 5 March 2025
Testing dApps: Frameworks, Best Practices & Pitfalls

Testing dApps: Frameworks, Best Practices & Pitfalls

Discover how to test decentralized applications with the right frameworks, best practices, and security-focused testing strategies. This guide explains smart contract testing, performance checks, and common pitfalls to help you build reliable, scalable, and secure dApps that deliver a seamless Web3 experience.

by manish 5 March 2025
Top Tools Frontend Developers Use to Speed Up Web Development

Top Tools Frontend Developers Use to Speed Up Web Development

Discover the top tools frontend developers use to speed up web development, improve coding efficiency, simplify UI design, and deliver high-performance, modern websites faster than ever.

by varsha 5 March 2025
React Native Developers vs Swift Developers for iOS Apps

React Native Developers vs Swift Developers for iOS Apps

Choosing between React Native developers and Swift developers can shape the success of an iOS app. This guide explains real differences, use cases, costs, and long-term impact.

by varsha 5 March 2025
How Salesforce Developers Build Scalable CRM Applications

How Salesforce Developers Build Scalable CRM Applications

This article explains how Salesforce developers build scalable CRM applications using real-world practices. It covers data design, automation, Apex, integrations, and user experience in simple, practical language.

by varsha 5 March 2025
Top Platforms & Tools for Building Serverless and Containerized Applications in 2025

Top Platforms & Tools for Building Serverless and Containerized Applications in 2025

Modern software development has shifted from monolithic architectures to more agile approaches. Serverless applications remove infrastructure concerns, while containerized applications ensure consistency across environments. In 2025, top platforms like AWS Lambda, Kubernetes, and Docker lead the way in scalability and efficiency. Businesses can adopt either model — or a hybrid approach — to build flexible, cost-effective, and future-ready applications.

by manish 5 March 2025
Top Reverse Proxy Tools

Top Reverse Proxy Tools

A reverse proxy is a critical component in modern web infrastructure that sits between client devices and backend servers to manage, secure, and optimize traffic. It provides key functionalities such as load balancing, SSL termination, caching, security filtering, application firewalling (via WAF), global server load balancing, URL rewriting, rate limiting, and protocol translation. Reverse proxies enhance application performance, scalability, and security while simplifying authentication and traffic management. Popular tools like NGINX, HAProxy, Traefik, Envoy, and managed services like AWS ALB and Azure Gateway cater to various use cases—from microservices and containerized apps to enterprise-grade security. As architectures evolve, reverse proxies are becoming more intelligent, integrated into service meshes, edge-focused, and AI-enhanced for real-time traffic optimization and threat detection, making them indispensable for delivering reliable, scalable, and secure digital experiences.

by manish 5 March 2025
Top API Testing Tools For Developers

Top API Testing Tools For Developers

This guide highlights the top API testing tools for developers in 2026, comparing platforms like Postman, SoapUI, Katalon, Insomnia, Hoppscotch and more to help teams automate and validate APIs efficiently.

by varsha 5 March 2025
Top GraphQL IDEs & Clients

Top GraphQL IDEs & Clients

GraphQL IDEs and clients have become essential tools in the modern API development lifecycle, offering powerful features for exploring, testing, visualizing, and monitoring GraphQL APIs. As the demand for flexible, schema-driven APIs grows, tools like GraphiQL, Apollo Studio, Postman, Insomnia, and others have emerged to support everything from query execution to performance observability and team collaboration. These platforms cater to a wide range of use cases—from solo developers and educators to large enterprise teams—by enhancing productivity, streamlining debugging, and promoting best practices. Looking ahead, advancements in AI, CI/CD integration, real-time collaboration, and security will continue to shape the future of GraphQL tooling.

by ankit 5 March 2025
Advanced Java Skills That Separate Junior and Senior Developers

Advanced Java Skills That Separate Junior and Senior Developers

This blog explains the advanced Java skills that truly separate junior and senior developers, covering core Java mastery, JVM internals, concurrency, system design, performance optimization, and real-world best practices needed to grow into a senior Java role.

by manish 5 March 2025
Role of NodeJS Developers in API-First Application Development

Role of NodeJS Developers in API-First Application Development

API-first development has become the backbone of modern digital products. This detailed guide explains how NodeJS developers design, build, and scale APIs that power flexible, future-ready applications.

by varsha 5 March 2025
Top iOS Frameworks Every iPhone App Developer Should Know

Top iOS Frameworks Every iPhone App Developer Should Know

Discover the most powerful iOS frameworks every iPhone app developer should master to build faster, scalable, secure, and performance-driven mobile applications.

by varsha 5 March 2025
Top Frameworks and Tools Used by Professional MEAN Stack Developers

Top Frameworks and Tools Used by Professional MEAN Stack Developers

This in-depth guide explores the most trusted frameworks and tools used by professional MEAN stack developers to build secure, scalable, and high-performance web applications. It explains how each tool fits into real-world development workflows, helping businesses and developers make smarter technology choices.

by ankit 5 March 2025
Top DevOps Tools Every Team Should Use

Top DevOps Tools Every Team Should Use

DevOps tools streamline software development by automating coding, testing, deployment, and monitoring, improving efficiency, collaboration, and security. Key tools like Jenkins, Docker, Kubernetes, Ansible, and Git enable faster releases, better infrastructure management, and consistent environments. Integrated security practices (DevSecOps) ensure early detection of vulnerabilities, while continuous monitoring and real-time feedback enhance software quality and resilience.

by ankit 5 March 2025
Top Tools and IDEs PHP Developers Use for Faster & Efficient Coding

Top Tools and IDEs PHP Developers Use for Faster & Efficient Coding

Discover the top tools and IDEs PHP developers use for faster, more efficient coding. Learn about editors, debugging tools, and workflow boosters to improve productivity and code quality.

by manish 5 March 2025