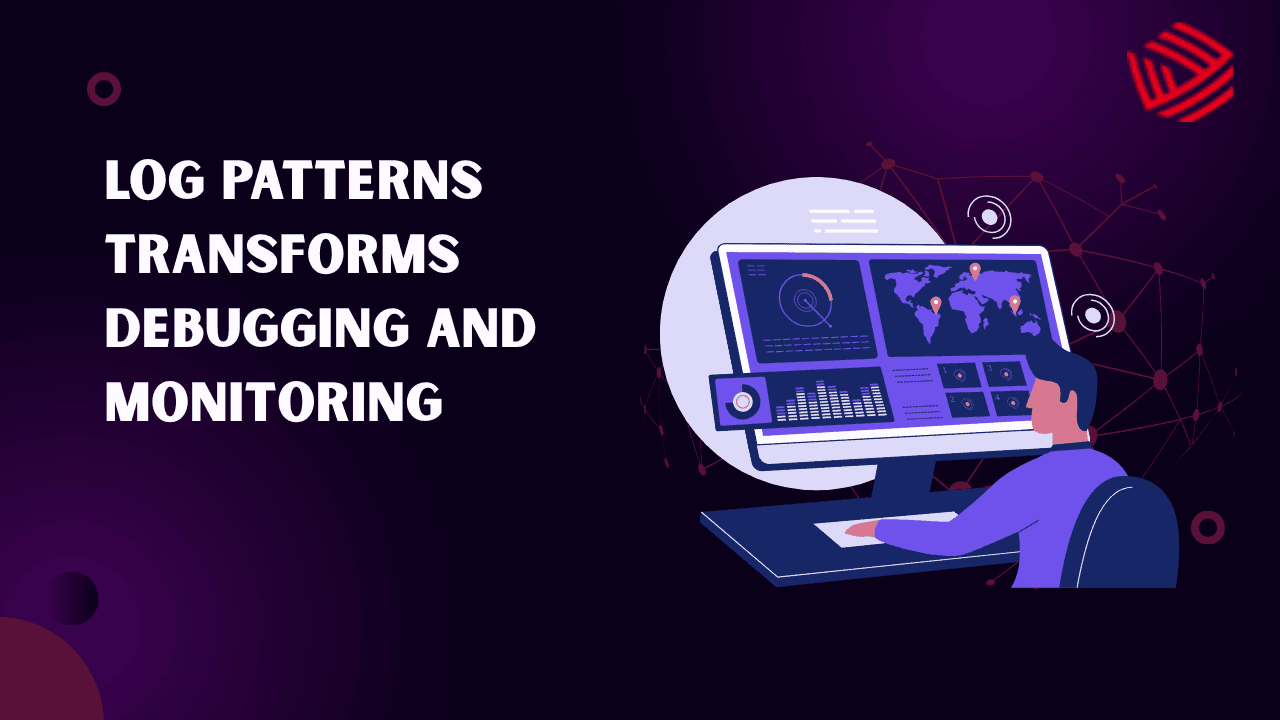
In today’s digital-first world, applications are the frontline of business. Slow response times, hidden bottlenecks, or downtime translate directly into frustrated users and lost revenue. That’s where Application Performance Management (APM) comes in — a suite of tools and practices aimed at monitoring, diagnosing, and optimizing application behavior across user ends, code, and infrastructure. As architectures become more distributed (microservices, containers, serverless), the challenge of maintaining performance grows. The right APM solution helps engineering teams stay ahead of issues, reduce mean time to resolution (MTTR), and align technical health with business outcomes. We’ll review the best APM tools, examine the key criteria for selecting one, and provide guidance on getting maximum value from your investment.
In an era where milliseconds define user satisfaction, performance management is no longer an afterthought — it’s a business necessity. From eCommerce platforms to SaaS applications, every lag or crash can impact revenue and brand credibility. Application Performance Management (APM) tools provide the visibility and control engineering teams need to ensure consistent uptime and seamless user experiences. By integrating deep analytics, AI-driven automation, and real-time monitoring, APM solutions empower organizations to transform performance data into actionable intelligence — optimizing both code efficiency and customer trust.
What is APM & Why It Matters
APM — sometimes called application performance monitoring — refers to the process and toolset used to monitor the availability, performance, and user experience of software applications.
Key functions typically include:
- Monitoring user experience (real-user monitoring / synthetic transactions)
- Transaction, request, and code-level tracing across services
- Infrastructure and component monitoring (servers, containers, databases)
Why it matters:
- For complex modern apps, unseen bottlenecks in code or infrastructure can degrade UX and harm SLAs. APM provides visibility.
- It accelerates troubleshooting, reducing MTTR and proactively identifying problems.
- It aligns engineering KPIs with business outcomes (uptime, user satisfaction, conversion).
Key Criteria for Choosing an APM Tool
When evaluating APM solutions, here are essential factors to consider:
- End-to-end visibility – Does the tool provide insights from front-end user interactions to back-end code and database queries?
- Distributed tracing & transaction context – In microservices and containerized environments, tracing across services is critical.
- Scalability & architecture support – Does it support cloud, containers (Kubernetes/Docker), serverless? Can it keep up with dynamic architecture?
- Analytics and root-cause diagnostics – Does it help isolate bottlenecks intelligently (via AI/ML, anomaly detection)?
- Ease of deployment & integration – Agents, instrumentation overhead, and compatibility with your tech stack.
- Business metrics & user experience – Beyond IT metrics, can it translate data to business KPIs (conversion, error impact)?
- Cost & licensing model – Does pricing scale sensibly with usage, hosts, transactions?
- Vendor ecosystem & future-proofing – Support for evolving architectures, languages, and frameworks.
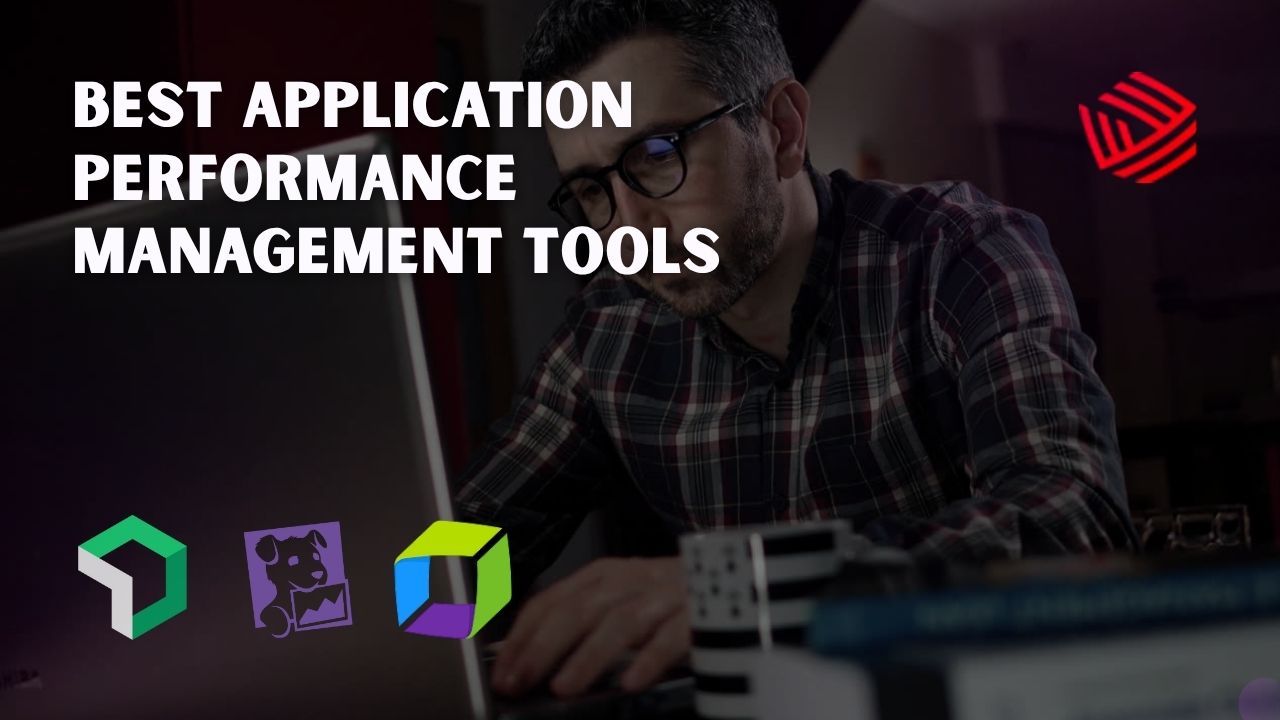
Best APM (Application Performance Management) Tools
Datadog APM
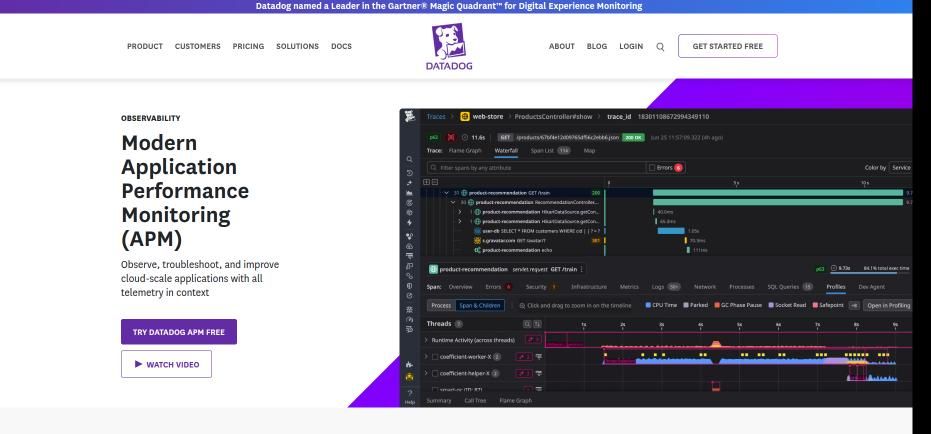
Datadog’s APM is a unified observability solution that correlates metrics, traces, and logs in one place. It provides powerful distributed tracing to visualize dependencies across microservices and quickly isolate performance bottlenecks. Teams benefit from AI-powered insights that automatically detect anomalies and suggest optimization actions. Its dashboards are highly customizable, helping DevOps engineers monitor performance in real time across hybrid or multi-cloud setups. Datadog also integrates seamlessly with Kubernetes, AWS, and CI/CD pipelines, offering scalability and automation for large-scale systems with dynamic workloads.
| Aspect | Details |
| Best For | Cloud-native environments, microservices, and DevOps workflows |
| Key Features | Distributed tracing, unified observability (logs, metrics, traces), AI-assisted diagnostics |
| Integrations | AWS, Kubernetes, Docker, Terraform, GitHub, Slack |
| Deployment Type | SaaS (cloud-based) |
| Unique Advantage | AI-powered anomaly detection and automatic dependency mapping |
| Ideal Use Case | Real-time visibility across dynamic, containerized architectures |
New Relic One
New Relic One stands out for its full-stack observability, connecting front-end UX data with backend performance and infrastructure health. It helps teams track application dependencies, latency, and throughput across complex distributed environments with minimal setup. The platform’s intuitive UI and powerful analytics make performance diagnosis faster and more accessible. In addition to monitoring, New Relic provides synthetic testing, error tracking, and custom dashboards for real-user experience insights. Its unified telemetry data model allows businesses to align app performance metrics directly with SLAs, ensuring reliability and user satisfaction across all services.
| Aspect | Details |
| Best For | Full-stack observability with a focus on UX and frontend-backend correlation |
| Key Features | Real user monitoring (RUM), distributed tracing, anomaly detection, synthetic testing |
| Integrations | AWS, Azure, GCP, Kubernetes, Jenkins, Slack |
| Deployment Type | SaaS (cloud and hybrid compatible) |
| Unique Advantage | Unified telemetry data model combining app, infra, and user experience metrics |
| Ideal Use Case | Businesses seeking holistic visibility into performance and customer experience |
Dynatrace
Dynatrace takes APM to the next level with AI-driven automation powered by its Davis AI engine, offering real-time root cause detection without manual configuration. It automatically discovers all components, maps service dependencies, and provides precise insights into anomalies affecting performance or reliability. This hands-free intelligence helps reduce MTTR dramatically. Its deep support for modern architectures—containers, serverless, and multi-cloud—makes Dynatrace ideal for enterprise environments. The platform’s continuous topology mapping ensures observability even as infrastructure scales or changes, keeping teams proactive rather than reactive in performance management.
| Aspect | Details |
| Best For | Enterprises with complex multi-cloud or hybrid infrastructures |
| Key Features | AI-driven root cause detection (Davis AI), topology mapping, service discovery |
| Integrations | AWS, Azure, GCP, Kubernetes, VMware, OpenShift |
| Deployment Type | SaaS / Managed / On-prem |
| Unique Advantage | Fully automated discovery, baselining, and performance correlation |
| Ideal Use Case | Large-scale organizations needing intelligent, automated observability |
Splunk APM (Observability Cloud)
Splunk APM brings a data-first approach to performance monitoring with powerful correlation between traces, metrics, and logs. Built on OpenTelemetry, it supports vendor-neutral instrumentation, enabling organizations to maintain flexibility across toolchains. Its focus on real-time, high-cardinality data ensures visibility into every transaction and anomaly. The tool also excels at contextual debugging—connecting traces to infrastructure events, security alerts, and code changes. This comprehensive observability helps teams trace user issues from frontend behavior to backend latency, making Splunk a preferred choice for high-volume, data-driven environments.
| Aspect | Details |
| Best For | High-volume, data-intensive environments requiring real-time analytics |
| Key Features | OpenTelemetry support, high-cardinality data analysis, AI-driven correlation |
| Integrations | OpenTelemetry, AWS, Kubernetes, Jenkins, GitLab |
| Deployment Type | SaaS (cloud) |
| Unique Advantage | Deep trace-to-log correlation for fast root cause identification |
| Ideal Use Case | Teams focusing on end-to-end data correlation and real-time troubleshooting |
AppDynamics
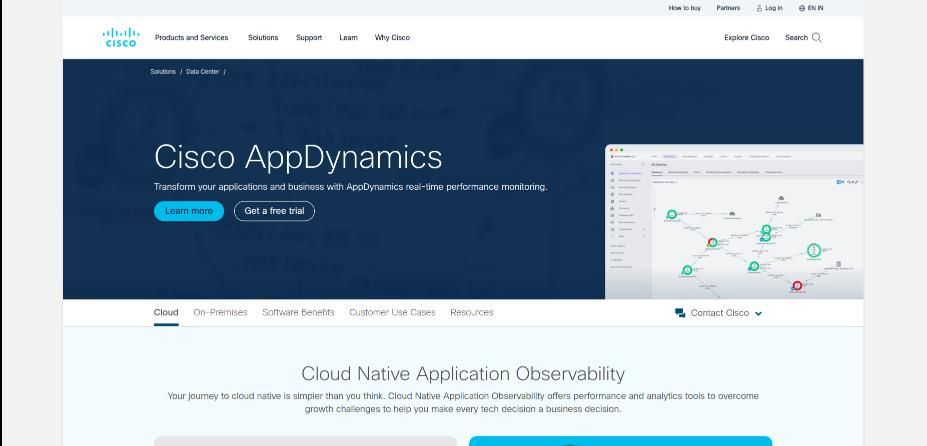
AppDynamics, a Cisco company, specializes in connecting application performance to business outcomes. Its “business transaction” monitoring model helps teams identify how code-level issues impact user satisfaction and revenue metrics. This business-first observability ensures that technical optimization always aligns with strategic goals. The platform integrates deeply with enterprise ecosystems like SAP, Kubernetes, and hybrid infrastructures. With features like anomaly detection and automatic baselining, AppDynamics enables proactive monitoring and predictive performance management across critical digital experiences.
| Aspect | Details |
| Best For | Enterprises needing business transaction monitoring and performance-to-revenue mapping |
| Key Features | Business transaction analytics, anomaly detection, baselining, hybrid monitoring |
| Integrations | Cisco ecosystem, SAP, Kubernetes, AWS, Azure |
| Deployment Type | On-premise, SaaS, Hybrid |
| Unique Advantage | Direct linkage between app performance and business KPIs |
| Ideal Use Case | Organizations aligning digital performance with revenue and customer impact |
Best Practices for Implementation
To get the most from your APM(Application Performance Management) investment, follow these steps:
- Define performance KPIs upfront: Set benchmarks for latency, throughput, and SLA thresholds.
- Instrument early and continuously: Deploy agents/instrumentation before production load to baseline performance.
- Correlate data across stack: Link user sessions, service calls, DB queries, and infrastructure metrics in one unified view.
- Use dashboards and alerts wisely: Avoid alert fatigue by setting contextual, threshold-based triggers.
- Leverage AI features: Use intelligent alerting and anomaly detection to reduce manual triage.
- Prioritize business outcomes: Connect technical metrics to customer satisfaction or conversion rates.
- Review regularly: Revisit configurations as architecture evolves or traffic scales.
Common Pitfalls & How to Avoid Them
- Fragmented tooling: Using separate tools for logs, metrics, and traces causes silos. Prefer unified platforms.
- High instrumentation overhead: Choose lightweight agents and sampling strategies to manage cost and performance.
- Ignoring business context: APM should connect technical health to real business impact.
- Static thresholds: Update alert policies as baselines shift over time.
- Failure to act: Insights are useless without defined workflows for incident response.
Conclusion
Selecting the right APM tool isn’t just a technical choice — it’s a strategic one that shapes reliability, scalability, and customer trust. As modern systems grow in complexity, observability becomes non-negotiable. Platforms like Datadog, New Relic, Dynatrace, Splunk, and AppDynamics lead the pack, but the best choice depends on your architecture and goals.
Investing in APM means empowering teams to move faster, fix smarter, and deliver better digital experiences — where performance becomes your competitive advantage. Ultimately, APM isn’t just about monitoring—it’s about creating a culture of continuous performance improvement. The insights gained from these tools can drive smarter scaling decisions, reduce operational costs, and enhance user satisfaction. Whether you’re managing microservices across multiple clouds or optimizing a single-page web app, a strong APM strategy ensures that performance remains a competitive differentiator. As digital ecosystems evolve, teams that master observability and automation through APM will lead the way in delivering faster, more resilient, and more intelligent software experiences.