Monitoring, logging, and visualization have become critical in today’s distributed, microservice-driven architectures. Whether you're a Full Stack Developer deploying web applications or an AWS Developer managing complex cloud infrastructure, having the right visualization tool for logs and metrics can make or break your debugging, performance tuning, and observability workflows. Two tools often in the spotlight are Kibana and Grafana. Both are powerful, but they serve slightly different purposes and ecosystems. Let's see pros/cons, use cases and other factors of the tools for choosing the option as per the requirements.
What is Kibana?
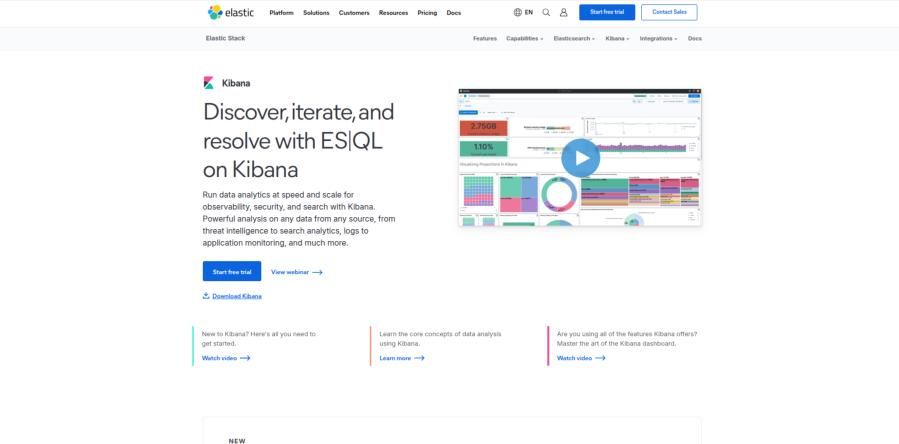
Kibana is an open-source data visualization and exploration tool designed primarily for log data. It is the default visualization tool for Elasticsearch and is part of the ELK Stack (Elasticsearch, Logstash, Kibana). Kibana is best suited for teams already leveraging the Elastic ecosystem for centralized logging and search analytics. Its interface is highly intuitive for visualizing large volumes of event data, allowing developers to drill down into patterns, anomalies, and correlations effortlessly. For AWS developers using Elasticsearch Service, Kibana provides a native-like experience with minimal setup. While it shines in log analysis, its dependency on Elasticsearch means it’s less versatile for metrics-driven use cases or multi-source data environments.
Key Features of Kibana:
- Real-time log and event monitoring.
- Rich dashboard capabilities for time-series data.
- Deep integration with Elasticsearch.
- Anomaly detection (via ML plugins).
- Alerting via Watcher or Kibana Alerting UI.
- Map-based visualizations (geo-spatial analysis).
- Security features (with Elastic Stack subscriptions).
What is Grafana?
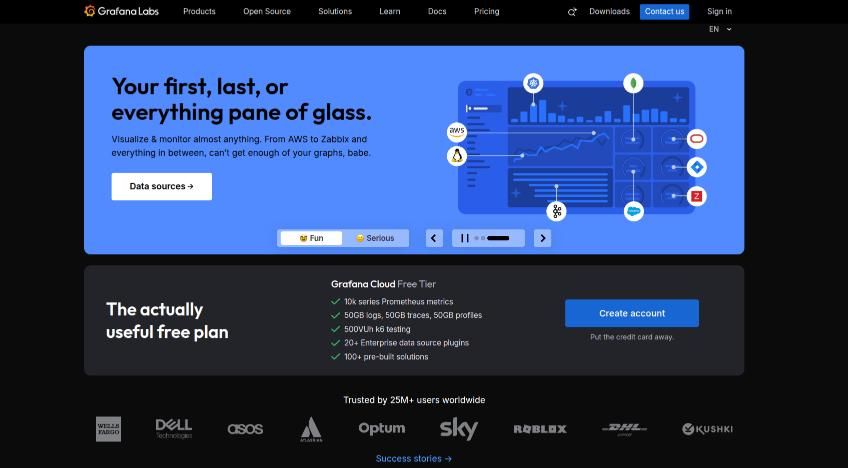
Grafana is a multi-platform open-source analytics and interactive visualization web application. It supports a wide range of data sources including Prometheus, Elasticsearch, AWS CloudWatch, InfluxDB, MySQL, and more. Grafana is a go-to choice for developers and DevOps teams who need unified observability across metrics, logs, and traces from multiple environments. Its flexibility allows full-stack developers to build dynamic dashboards that blend performance data, user analytics, and cloud metrics in one place. For AWS users, Grafana integrates deeply with CloudWatch, CloudTrail, and X-Ray, turning raw telemetry into actionable insights. Although it has a slightly steeper learning curve, its open-source foundation and massive plugin ecosystem make it an incredibly powerful tool for long-term scalability and customization.
Key Features of Grafana:
- Support for multiple data sources (SQL, NoSQL, cloud-native tools).
- Custom dashboards with variables and templating.
- Alerting and notification channels.
- Flexible query editor per data source.
- Role-based access control (RBAC).
- Plugins for extended visualization types and data sources.
Why This Comparison Matters to Full Stack & AWS Developers
Both Kibana and Grafana offer compelling features, but their fit varies depending on:
- Your development role (backend, frontend, cloud engineer, DevOps).
- Your data architecture (metrics, logs, or both).
- Your cloud strategy (on-premise, hybrid, AWS-native).
- Your observability goals (monitoring performance vs. debugging issues).
Comparing across critical dimensions for Full Stack and AWS Developers
Architecture & Data Source Support
Kibana and Grafana have fundamentally different architectures, which directly influence how they fit into development and DevOps workflows. Kibana is tightly coupled with Elasticsearch, making it the ideal tool for teams that have standardized on the ELK Stack for log ingestion and storage. It excels at processing structured and unstructured log data, enabling developers to build time-series visualizations from Elasticsearch indexes and drill down into individual logs. With integrations like Logstash, Beats, and Elastic Agent, Kibana ensures a smooth pipeline for collecting, filtering, and visualizing logs.
Grafana, on the other hand, is built around a pluggable data source architecture. It supports a broad array of sources such as Prometheus, AWS CloudWatch, InfluxDB, Graphite, and Loki, allowing teams to query multiple systems in a single dashboard. This makes Grafana highly suitable for multi-cloud or hybrid environments where metrics are spread across diverse tools. Full Stack and AWS developers benefit from this flexibility, as it allows them to unify infrastructure, application, and performance metrics into cohesive, real-time visualizations.
| Category | Kibana | Grafana |
|---|---|---|
| Data Source Architecture | Tightly coupled with Elasticsearch | Pluggable data sources (Prometheus, AWS CloudWatch, etc.) |
| Log Support | Excellent | Strong with Loki |
| Metrics Support | Moderate | Excellent |
| Integration Complexity | Simple (within ELK) | Moderate (per data source) |
| Best Fit For | ELK-based log environments | Multi-cloud, containerized, or AWS-native systems |
Visualization Capabilities
When it comes to visualizing data, Kibana shines in log-centric scenarios. It provides advanced search capabilities using Lucene Query Language (KQL), enabling developers to drill down into logs with fine-grained filtering. Kibana is particularly strong for correlating events and tracing issues across distributed systems, which is essential for debugging microservices or monitoring geo-distributed applications. Its time-series visualizations, though effective, are primarily tied to Elasticsearch indices, which can limit versatility if your metrics reside elsewhere.
Grafana offers a more flexible visualization experience. It provides a wide range of charts, including histograms, gauges, heatmaps, and more, which makes it ideal for real-time monitoring of metrics. Dashboard templating allows teams to manage multiple environments or services efficiently, while its rich plugin ecosystem enables custom visualizations tailored to specific needs. Grafana’s strength lies in combining logs and metrics on a single dashboard, which is invaluable for Full Stack and AWS developers managing both application and infrastructure performance.
| Feature | Kibana | Grafana |
|---|---|---|
| Log-Centric Dashboards | Excellent | Moderate |
| Time-Series Graphs | Good | Excellent |
| Heatmaps, Gauges, Panels | Limited | Extensive |
| Dashboard Templating | Basic | Advanced |
| Custom Plugins | Fewer | Rich Marketplace |
Alerting & Notifications
Kibana provides robust alerting for Elasticsearch-based datasets. Alerts can be configured through the Kibana Alerting UI or Elastic Watcher, triggering notifications via email, Slack, webhook, or Jira. However, alerting is limited to Elasticsearch data, and some advanced features are available only in Platinum or Enterprise tiers. For teams already embedded in the ELK ecosystem, Kibana alerting is convenient and effective for monitoring log events, security incidents, or performance thresholds.
Grafana’s alerting engine is more versatile. It allows monitoring across multiple data sources with configurable thresholds, conditions, and “no-data” triggers. Integration with Slack, PagerDuty, Microsoft Teams, and email enables real-time notifications, making it a powerful tool for distributed teams. This flexibility is especially useful for AWS or multi-cloud environments where metrics may be scattered across different platforms, ensuring that no critical event goes unnoticed.
| Feature | Kibana | Grafana |
|---|---|---|
| Alert Sources | Elasticsearch only | Multiple (CloudWatch, Prometheus, etc.) |
| Integration Options | Email, Slack, Webhook | Slack, Teams, PagerDuty, Email, Webhook |
| Cross-Source Alerts | Not Supported | Supported |
| UI for Alerting | Kibana Alerting UI | Grafana Alerting UI |
| Best For | Elastic users | Cross-platform monitoring teams |
Log Management & Analysis
Log management is Kibana’s core strength. Designed for exploration and analysis of textual data, it enables developers to perform full-text searches, filter logs by service, and trace user sessions. Kibana’s integration with Elastic APM further enhances its capabilities by providing transaction tracing, error diagnostics, and detailed insights into microservices or API calls. This makes it ideal for backend or Full Stack developers who need deep visibility into operational logs for debugging and performance optimization.
Grafana was historically limited in log analysis, but the introduction of Grafana Loki has closed the gap. Loki integrates seamlessly with Prometheus, enabling metric and log correlation on the same dashboard. While Kibana still leads in textual search capabilities, Grafana with Loki provides a unified view for teams that want to monitor metrics and logs together. This combination is particularly helpful in containerized environments or hybrid cloud architectures, where observability spans multiple systems.
| Feature | Kibana | Grafana (with Loki) |
|---|---|---|
| Text Search | Advanced via KQL/Lucene | Basic (Loki log queries) |
| Tracing Integration | Elastic APM | Partial (via Tempo) |
| Performance Debugging | Excellent | Moderate |
| Log-to-Metric Correlation | Limited | Strong (Loki + Prometheus combo) |
| Best Use Case | Deep debugging | Metric-driven log correlation |
Security & Access Controls
Security and access control are critical for professional development teams. Kibana provides role-based access via Elastic Stack X-Pack, allowing fine-grained control over dashboards, visualizations, and data views. Enterprise subscriptions offer additional features such as SSO, audit logging, and advanced RBAC, ensuring compliance in regulated environments. For teams heavily invested in Elasticsearch, these features make Kibana a reliable choice for secure log analytics.
Grafana provides open-source RBAC by default, with enterprise options offering SSO, LDAP, audit logs, and team syncing. Its plugin-based security customization allows startups and SMBs to implement enterprise-grade controls without paying high licensing fees. Grafana’s flexibility makes it attractive for teams operating in multi-cloud or hybrid setups, providing a balance between security, accessibility, and cost-efficiency.
| Security Feature | Kibana | Grafana |
|---|---|---|
| RBAC (Role-Based Access Control) | Available in paid X-Pack | Available in open-source |
| SSO / LDAP / Audit Logs | Enterprise tier only | Enterprise or Cloud version |
| API Security | Token-based | API keys and fine-grained permissions |
| Data Encryption | Yes | Yes |
| Best For | Enterprise ELK setups | SMBs and hybrid teams needing flexibility |
Cloud-Native & AWS Integration
Kibana integrates natively with AWS Elasticsearch services, such as OpenSearch or Amazon ES, providing a smooth experience for developers using AWS-managed Elasticsearch clusters. It also supports Beats and Logstash for ingesting AWS logs from services like CloudWatch, making it suitable for log-heavy workloads. This tight integration ensures minimal setup for AWS developers while maintaining consistent log pipelines across regions.
Grafana, in contrast, offers first-class support for a wide range of AWS services including CloudWatch, X-Ray, Timestream, and IoT. Grafana Cloud and Amazon Managed Grafana provide fully managed, one-click integrations for AWS developers, enabling real-time visualization and alerting without complex configurations. Grafana’s ability to unify AWS and non-AWS metrics and logs makes it a top choice for teams adopting hybrid or multi-cloud strategies, delivering end-to-end observability across the infrastructure stack.
| AWS Service / Function | Kibana | Grafana |
|---|---|---|
| ElasticSearch Service | Native | Supported |
| AWS CloudWatch Metrics | Indirect | Native |
| AWS X-Ray Tracing | Partial | Direct Integration |
| AWS Managed Version | Elastic Cloud on AWS | Amazon Managed Grafana |
| Ideal For | Teams using AWS OpenSearch | AWS DevOps & Cloud-Native Developers |
Use Cases: Kibana vs Grafana in Real Developer Scenarios
Full Stack Developer Use Cases
Use Case | Best Tool | Why |
| Debugging Node.js/Express app logs | Kibana | Advanced log search and correlation with user sessions |
| Visualizing frontend error rates from browser logs | Kibana | Kibana + Beats can ingest JS/browser logs |
| Monitoring backend response time & latency | Grafana | Prometheus + Grafana time-series dashboards |
| Merging logs + metrics from containerized apps | Grafana + Loki(Extra tool) | Unified view via Grafana templated dashboards |
AWS Developer Use Cases
Use Case | Best Tool | Why |
| Monitoring EC2, Lambda, S3, and RDS metrics | Grafana | AWS CloudWatch + Grafana provides seamless integration |
| Viewing logs from CloudTrail or CloudWatch Logs | Kibana | Elastic Agent can ingest CloudWatch logs into Elasticsearch |
| Centralizing logs from multi-region deployments | Kibana | Elasticsearch index management across AWS regions |
| Unified view of AWS & non-AWS environments | Grafana | Multi-cloud dashboards from hybrid data sources |
Pros and Cons Summary of Both Tools
Kibana: Pros and Cons
Kibana is a visualization layer built specifically for the Elastic Stack, offering developers deep insights into log and event data. It shines in environments where Elasticsearch is the primary data store, providing seamless integration and powerful analytics. However, like any specialized tool, it comes with limitations that are worth considering before adoption.
| Pros | Cons |
|---|---|
| Deep integration with Elasticsearch, enabling seamless data visualization and querying. | Limited to Elasticsearch backend, reducing flexibility with other data sources. |
| Offers powerful log analytics and search, ideal for full-stack and AWS developers handling large log volumes. | Many advanced features like alerting, machine learning, and security are locked behind enterprise licenses. |
| Provides mature support for geo-data and APM, allowing deep insight into distributed application performance. | Not ideal for non-log or multi-metric environments, which limits cross-database analysis. |
| Intuitive UI for log-based debugging, enabling faster troubleshooting and monitoring. | Customization and scalability can become complex without Elastic’s paid tools and infrastructure. |
Grafana: Pros and Cons
Grafana stands out as a flexible and extensible observability platform that supports a wide range of data sources. Its customizable dashboards and rich visualization options make it a favorite among cloud-native and AWS-focused teams. Still, the setup and configuration demands can pose challenges, especially for those working heavily with logs.
| Pros | Cons |
|---|---|
| Multi-data source support allows integration with Prometheus, InfluxDB, Elasticsearch, AWS CloudWatch, and more — giving developers unmatched flexibility. | Requires configuration per data source, which can add setup time and maintenance overhead. |
| Flexible and customizable dashboards enable precise visual storytelling across metrics, traces, and logs. | Slightly steeper learning curve for logs, especially for developers transitioning from tools like Kibana. |
| Powerful time-series visualizations make it a favorite for performance monitoring and DevOps observability. | Native log querying not as strong without Loki, limiting full-stack log analysis out of the box. |
| Ideal for AWS-native workflows, easily connecting with CloudWatch, X-Ray, and other AWS monitoring tools. | — |
| Open-source friendly alerting and RBAC, offering strong community support and enterprise-ready security layers. | — |
Kibana vs Grafana – Which One Should Full Stack & AWS Developers
As digital infrastructures grow increasingly complex, observability is no longer a luxury—it’s a necessity. For Full Stack Developers building dynamic frontends and scalable backends, or AWS Developers managing microservices, containers, and cloud-native applications, the ability to visualize, monitor, and troubleshoot data in real-time is crucial.
We looked into the comparison of Kibana vs Grafana, we’ve walked through their features, strengths, limitations, and use cases in depth. Now, let’s bring everything together into a full-picture conclusion—layered, nuanced, and designed specifically for today’s developers.
1. Understanding the Core Philosophies
At their core, Kibana and Grafana were built with different philosophies:
- Kibana focuses on log analytics and is deeply integrated into the Elastic Stack (ELK). It is built for developers who need rich querying and contextual insights into textual data—such as system logs, user activity traces, or API call histories.
- Grafana, in contrast, emphasizes visualizing time-series metrics across diverse data sources. Its ability to bring together performance, infrastructure, application, and user metrics makes it indispensable for cloud-native development teams.
For Full Stack Developers, these philosophies matter. You’re not just looking at data—you’re navigating between logs, frontend metrics, API response times, and database performance. A tool that adapts to your ecosystem is essential.
2. When to Choose Kibana: The Log Intelligence Powerhouse
If your primary concern is log data, textual search, and event analysis, Kibana shines brightly. It delivers unparalleled capabilities in these areas:
- Advanced log exploration: Kibana’s integration with Elasticsearch allows for complex queries using KQL or Lucene. This helps pinpoint root causes quickly.
- APM Tracing: With Elastic APM, you can visualize backend transactions and monitor the performance of critical services.
- Geo-aware data: Developers working on delivery platforms or geolocation services can use Kibana’s Maps for real-time data overlays.
- Structured debugging: Kibana is excellent for filtering logs by services, error codes, users, etc., and piecing together request timelines.
However, it’s important to understand that Kibana operates best in ecosystems that are already invested in Elasticsearch. If your logs are in CloudWatch, Datadog, or other sources, you’ll need extra effort (or costs) to pipe data into Elasticsearch.
This makes Kibana the ideal tool for:
- Backend or Full Stack developers working in log-heavy environments.
- Teams already using the ELK Stack.
- Developers building systems that need deep post-mortem investigation from logs.
3. When to Choose Grafana: The Metrics and Dashboard King
On the other side, Grafana provides an exceptional, flexible, and powerful experience for developers who are dealing with metrics, alerts, and cloud monitoring.
Its key strengths include:
- Data Source Flexibility: Grafana’s ability to connect to Prometheus, CloudWatch, MySQL, Loki, and many more makes it a powerhouse for developers with hybrid stacks.
- Rich visualizations: From histograms and gauges to heatmaps and stat panels, Grafana supports highly customizable dashboards.
- Granular alerting: The alert system is not only powerful but flexible enough to monitor conditions across varied environments—ideal for SREs and DevOps teams.
- Real-time performance monitoring: Ideal for apps with strict latency or uptime requirements.
For AWS Developers, Grafana’s native support for CloudWatch, X-Ray, and Managed Grafana on AWS Marketplace means near-instant setup with end-to-end visibility across AWS services.
It is also the best tool for:
- Frontend or Full Stack Developers monitoring API performance, user latency, or load behavior.
- AWS Developers visualizing Lambda invocations, EC2 health, or Kubernetes clusters.
- Teams adopting a multi-cloud or container-first architecture (K8s, Docker, etc.).
4. Can You Use Both? Absolutely!
For many modern development teams, the question isn’t “Kibana or Grafana?” — it’s “Kibana AND Grafana.”
They serve complementary purposes:
| Task | Recommended Tool |
|---|---|
| Log debugging & root cause analysis | Kibana |
| Real-time monitoring & alerting | Grafana |
| Elasticsearch-driven log pipelines | Kibana |
| Prometheus-driven metric pipelines | Grafana |
| Visualizing AWS metrics & logs | Grafana (metrics), Kibana (logs) |
| Combining data sources into a single UI | Grafana |
By integrating Kibana for in-depth log queries and Grafana for metric dashboards and alerting, Full Stack and AWS teams can create a full-spectrum observability platform.
5. Security, Scalability, and Cost Considerations
When adopting a tool in a professional or enterprise environment, cost, security, and scalability can’t be ignored.
Security:
- Grafana (open source) provides essential RBAC features, while its Enterprise version includes SSO, audit logs, and LDAP integration.
- Kibana requires a subscription to Elastic Stack’s Platinum/Enterprise tiers for similar enterprise-grade controls.
Cost:
- Grafana’s OSS version is fully free and scalable.
- Kibana’s free tier is good, but advanced features are locked behind paid Elastic Stack plans.
Scalability:
- Kibana scales well within Elasticsearch clusters, making it effective in high-volume log environments.
- Grafana handles distributed systems better through Grafana Agent, Loki, and Tempo, giving it a Kubernetes-native edge.
These distinctions make Grafana more attractive for startups and small teams, while Kibana fits better into mature organizations with ELK at their core.
Use Cases in the Real World: What Professionals Are Doing
Full Stack Developer Journeys:
- Frontend Bug Tracking: Use Kibana to trace logs from the browser to the backend, helping trace XHR errors, session bugs, and API calls.
- Performance Optimization: Use Grafana dashboards to correlate traffic spikes with response time increases or resource utilization.
- CI/CD Monitoring: Grafana works well with Jenkins, GitHub Actions, and Kubernetes to monitor deployment health.
AWS Developer Workflows:
- Lambda Performance Monitoring: Grafana fetches metrics directly from AWS CloudWatch and visualizes them with low latency.
- CloudTrail Log Analysis: Send CloudTrail logs to Elasticsearch and use Kibana to explore login anomalies, security events, or data access.
- Hybrid Cloud Visualization: Grafana connects AWS, on-prem, and third-party monitoring into a single pane of glass.
Both tools are powering modern, intelligent DevOps environments. The ability to choose based on context—and sometimes to combine their power—is what makes developer operations efficient.
Conclusion
Both Kibana and Grafana stand as cornerstone tools in the observability landscape, but they shine in different domains. Kibana is purpose-built for deep log analytics, offering Elasticsearch-powered querying, visualization, and APM capabilities that help developers pinpoint issues across complex systems. Grafana, on the other hand, thrives in multi-source, metrics-driven environments, empowering teams to correlate performance data, visualize real-time trends, and monitor hybrid or AWS-native infrastructures with ease. Together, they represent two sides of modern monitoring—log intelligence and metrics observability.
For Full Stack and AWS Developers, the choice isn’t necessarily about picking one over the other but understanding their complementary roles. Kibana excels in debugging and root cause analysis, while Grafana provides the broader performance and reliability view essential for proactive monitoring. Many teams adopt both—using Kibana for detailed log insights and Grafana for unified dashboards across services and clouds. In the end, the right approach depends on your stack, your workflow, and your need for visibility—whether that’s deep log exploration, real-time performance tracking, or complete end-to-end observability.